

Question: Problem 2 (7.5 pts) are a scatter diagram for each of these data sets and then express in words the apparent relationship between the two
Problem 2 (7.5 pts)
are a scatter diagram for each of these data sets and then express in words the apparent relationship between the two variables. Put the first variable on the horizontal axis and the second variable on the vertical axis.
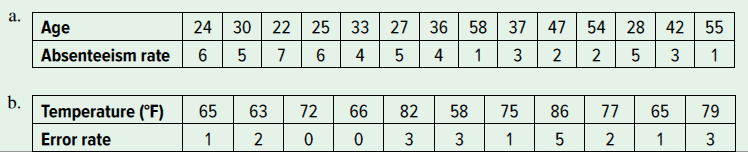
a. \begin{tabular}{|l|c|c|c|c|c|c|c|c|c|c|c|c|c|c|} \hline Age & 24 & 30 & 22 & 25 & 33 & 27 & 36 & 58 & 37 & 47 & 54 & 28 & 42 & 55 \\ \hline Absenteeism rate & 6 & 5 & 7 & 6 & 4 & 5 & 4 & 1 & 3 & 2 & 2 & 5 & 3 & 1 \\ \hline \end{tabular} b. \begin{tabular}{|l|c|c|c|c|c|c|c|c|c|c|c|} \hline Temperature (F) & 65 & 63 & 72 & 66 & 82 & 58 & 75 & 86 & 77 & 65 & 79 \\ \hline Error rate & 1 & 2 & 0 & 0 & 3 & 3 & 1 & 5 & 2 & 1 & 3 \\ \hline \end{tabular}
Step by Step Solution
There are 3 Steps involved in it

Get step-by-step solutions from verified subject matter experts