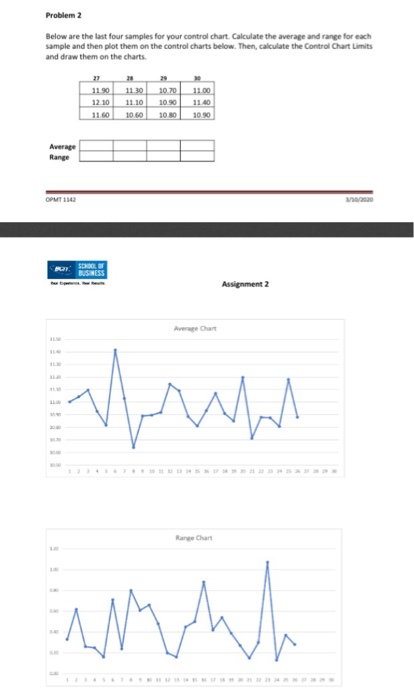
Question: Problem 2 Below are the last four samples for your control chart Calculate the average and range for each Sample and then plot them on

Problem 2 Below are the last four samples for
Problem 2 Below are the last four samples for your control chart Calculate the average and range for each Sample and then plot them on the control charts below. Then, ca te the Control Chart Limits and drew them on the charts 10 1130 11.10 Avery

Step by Step Solution

There are 3 Steps involved in it

1 Expert Approved Answer
Step: 1 Unlock blur-text-image
Question Has Been Solved by an Expert!

Get step-by-step solutions from verified subject matter experts

Step: 2 Unlock
Step: 3 Unlock

Students Have Also Explored These Related General Management Questions!