

Question: Problem 2 Control Chart Constants A process for filling liquid laundry detergent bottles monitors the volume in each bottle. The operations manager has taken 5
Problem Control Chart Constants
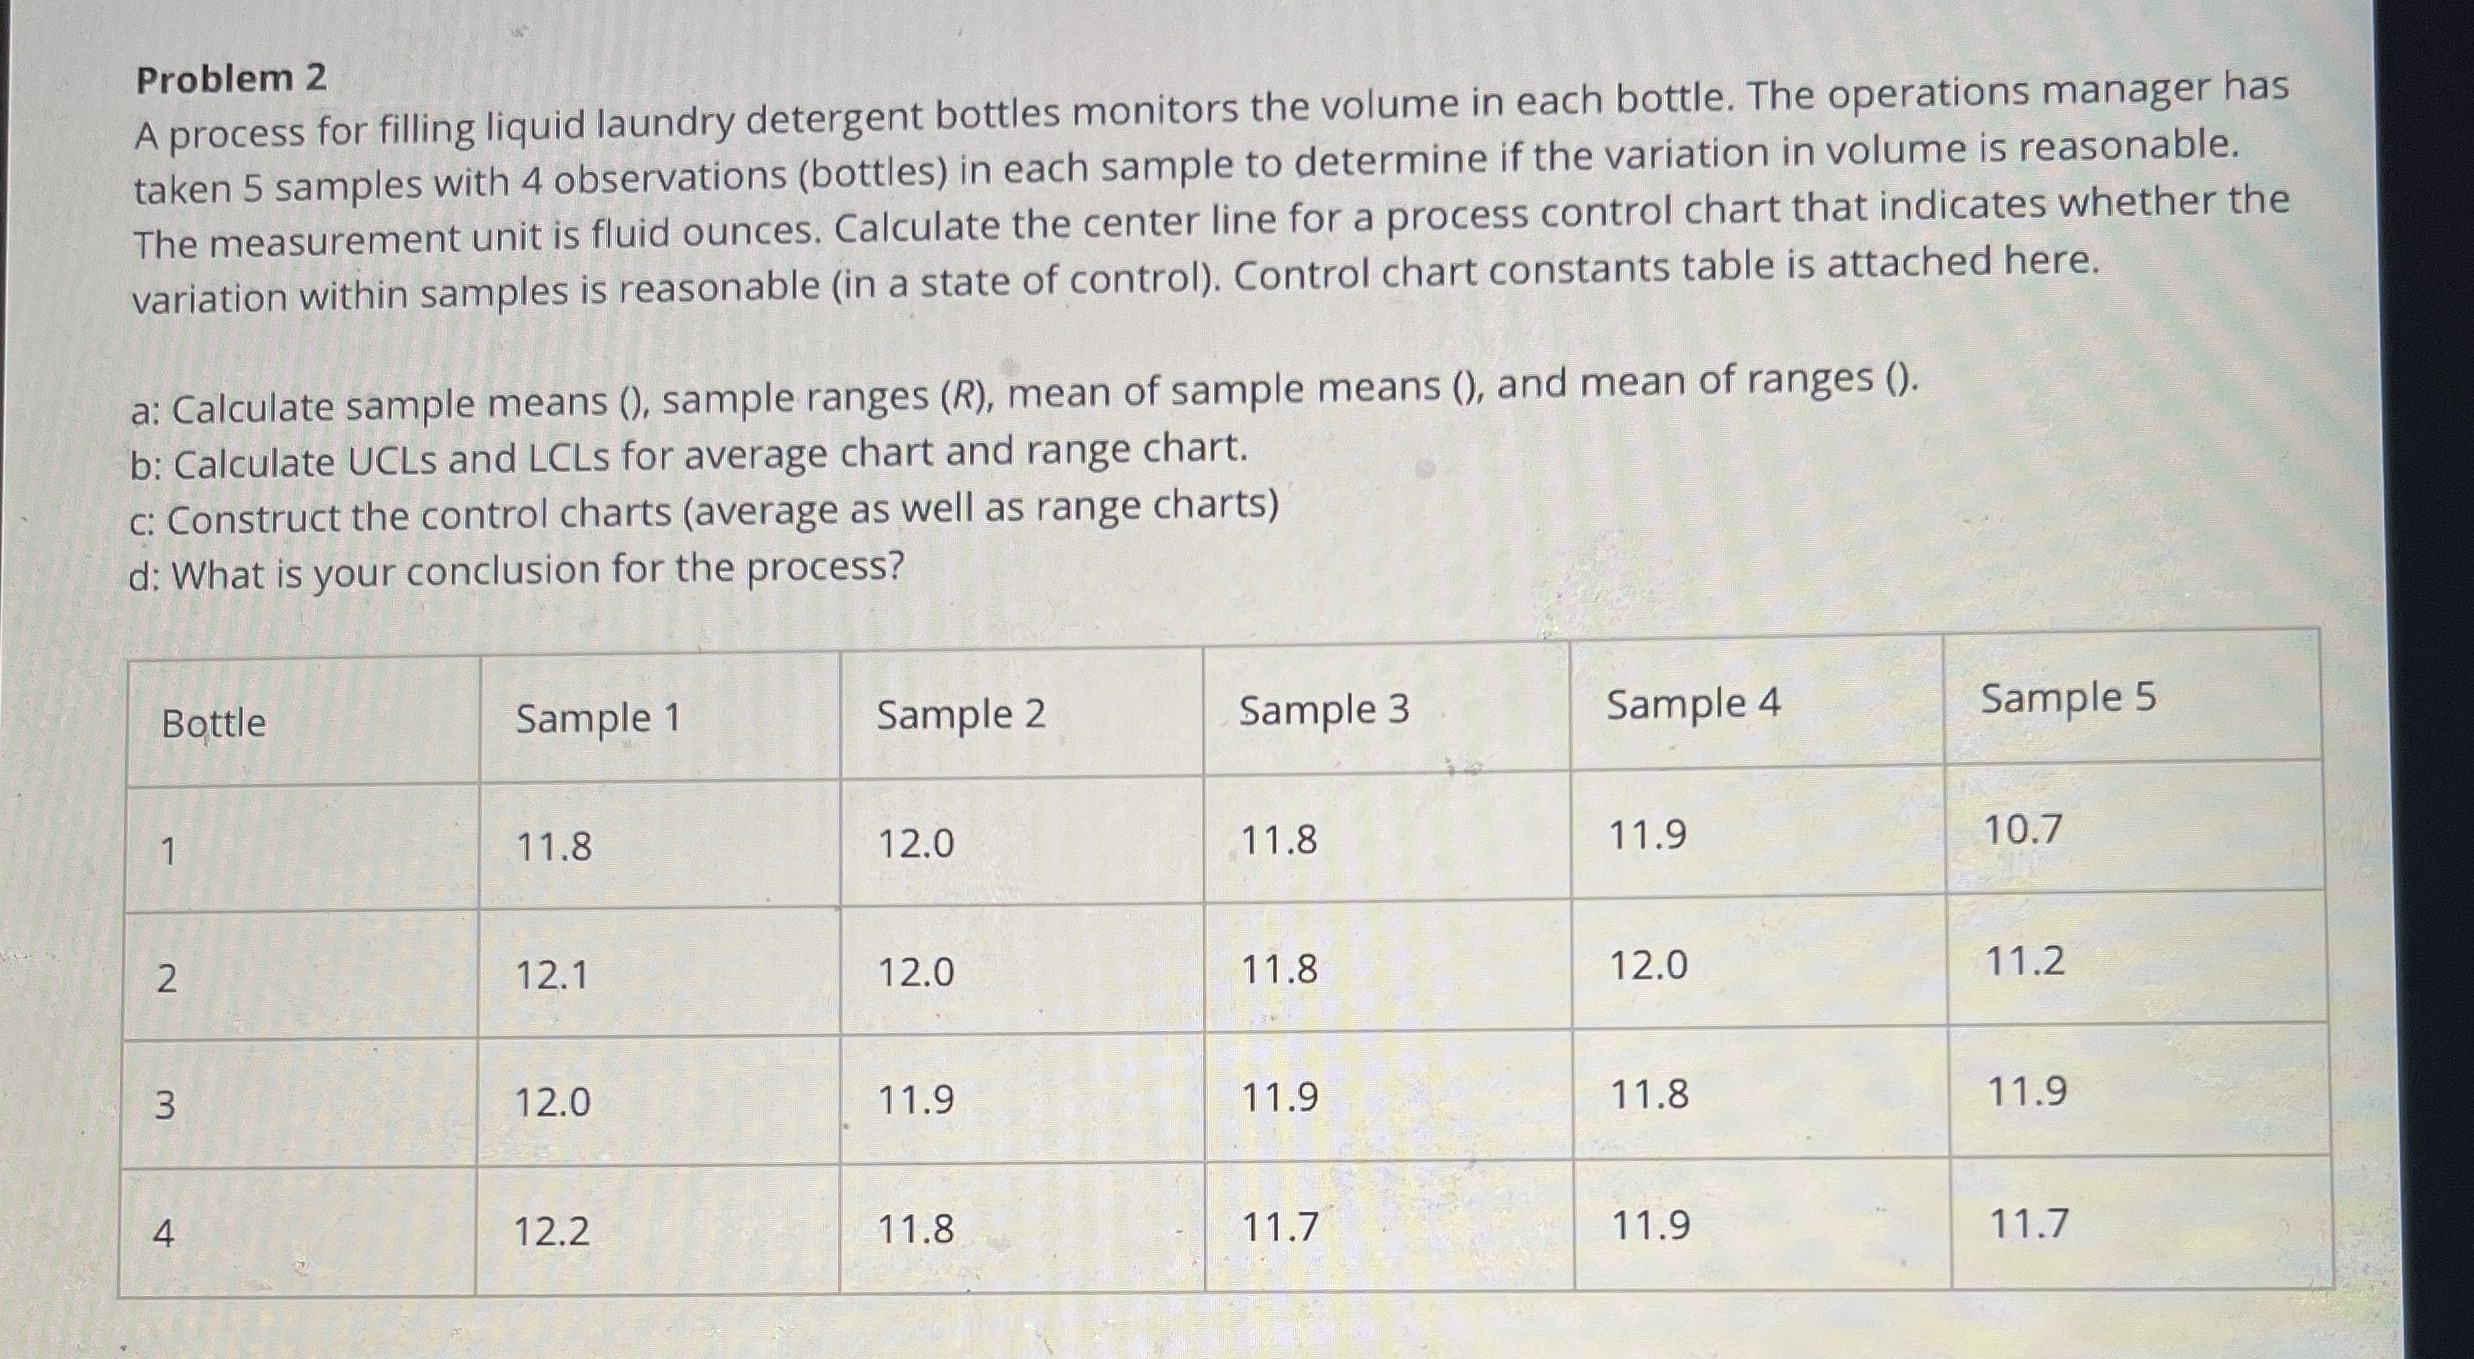
A process for filling liquid laundry detergent bottles monitors the volume in each bottle. The operations manager has
taken samples with observations bottles in each sample to determine if the variation in volume is reasonable.
The measurement unit is fluid ounces. Calculate the center line for a process control chart that indicates whether the
variation within samples is reasonable in a state of control Control chart constants table is attached here.
a: Calculate sample means sample ranges mean of sample means and mean of ranges
b: Calculate UCLs and LCLs for average chart and range chart.
c: Construct the control charts average as well as range
Control Chart Constants
Sample Size n
Use an Excel Spreadsheet
Step by Step Solution
There are 3 Steps involved in it
1 Expert Approved Answer
Step: 1 Unlock

Question Has Been Solved by an Expert!
Get step-by-step solutions from verified subject matter experts
Step: 2 Unlock
Step: 3 Unlock