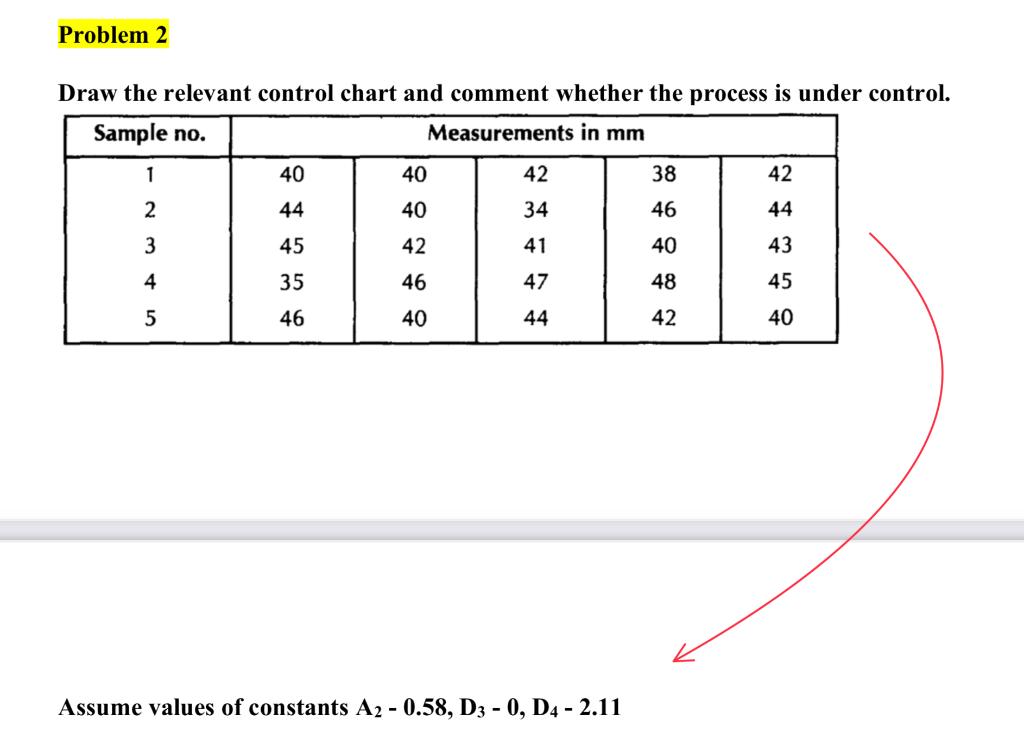
Question: Problem 2 Draw the relevant control chart and comment whether the process is under control. Sample no. Measurements in mm 1 40 40 42 38

Problem 2 Draw the relevant control chart and

Problem 2 Draw the relevant control chart and comment whether the process is under control. Sample no. Measurements in mm 1 40 40 42 38 42 2 44 40 34 46 44 3 45 42 41 40 43 4 35 46 47 48 45 5 46 40 44 42 40 Assume values of constants A2 - 0.58, D3 - 0, D4 - 2.11

Step by Step Solution

There are 3 Steps involved in it

1 Expert Approved Answer
Step: 1 Unlock blur-text-image
Question Has Been Solved by an Expert!

Get step-by-step solutions from verified subject matter experts

Step: 2 Unlock
Step: 3 Unlock

Students Have Also Explored These Related General Management Questions!