

Question: Problem 2: Simulation Modeling Table A Monte Carlo Simulation Tom has $5,000 he would like to invest for his son's first year of college. His
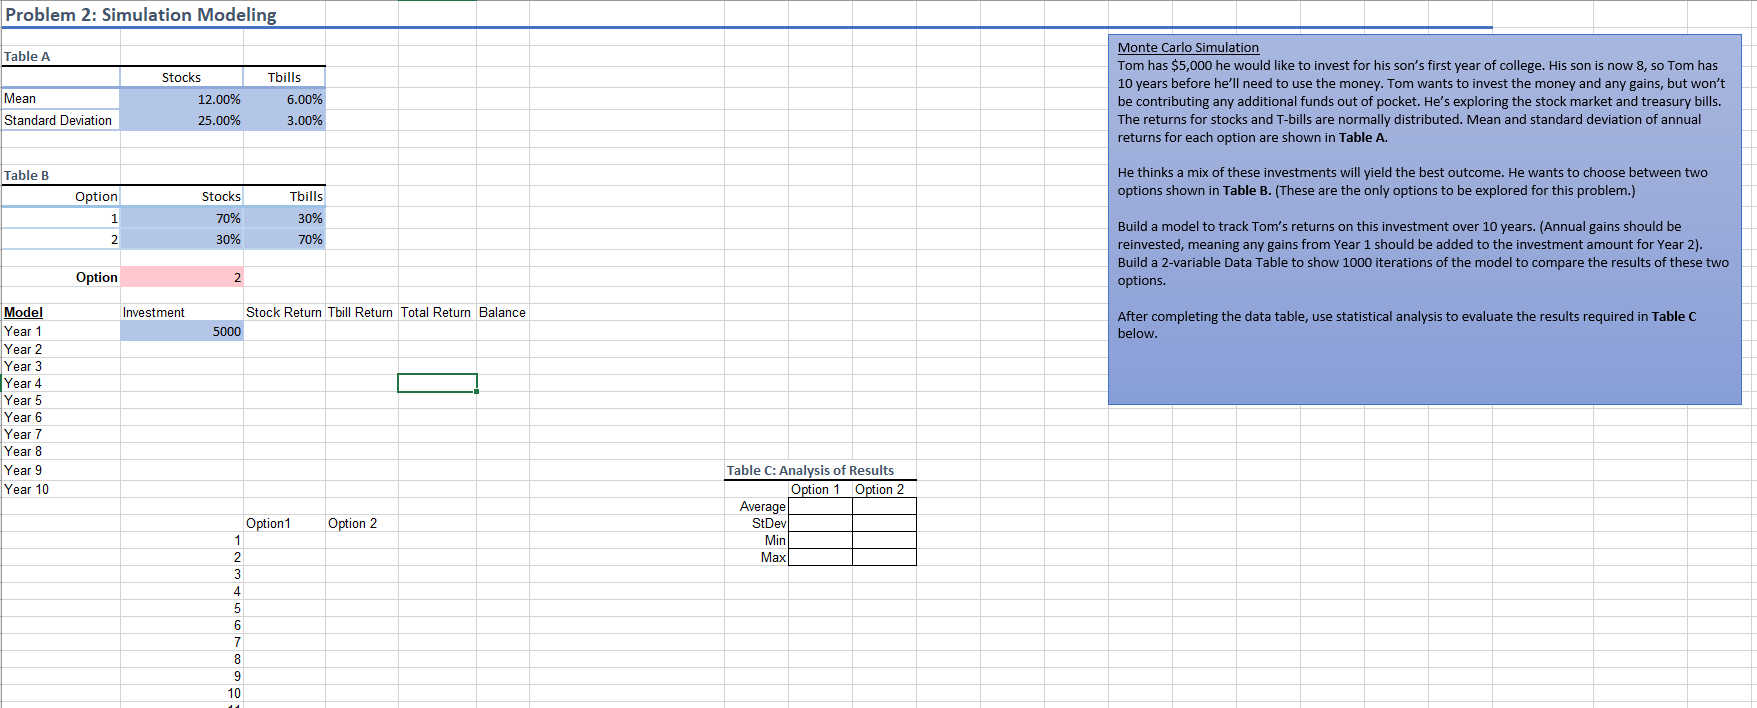
Problem 2: Simulation Modeling Table A Monte Carlo Simulation Tom has $5,000 he would like to invest for his son's first year of college. His son is now 8, so Tom has Stocks Tbills 10 years before he'll need to use the money. Tom wants to invest the money and any gains, but won't Mean 12.00% 5.00% be contributing any additional funds out of pocket. He's exploring the stock market and treasury bills. Standard Deviation 25.00% 3.00% The returns for stocks and T-bills are normally distributed. Mean and standard deviation of annual returns for each option are shown in Table A. Table B He thinks a mix of these investments will yield the best outcome. He wants to choose between two Option Stocks Tbills options shown in Table B. (These are the only options to be explored for this problem.) 70% 30% Build a model to track Tom's returns on this investment over 10 years. (Annual gains should be 2 30% 70% reinvested, meaning any gains from Year 1 should be added to the investment amount for Year 2). Build a 2-variable Data Table to show 1000 iterations of the model to compare the results of these two Option 2 options. Model Investment Stock Return Tbill Return Total Return Balance After completing the data table, use statistical analysis to evaluate the results required in Table C Year 1 5000 below. Year 2 Year 3 Year 4 Year 5 Year 6 Year 7 Year 8 Year 9 Table C: Analysis of Results Year 10 Option 1 Option 2 Average Option 1 Option 2 StDev Min Max
Step by Step Solution
There are 3 Steps involved in it

Get step-by-step solutions from verified subject matter experts