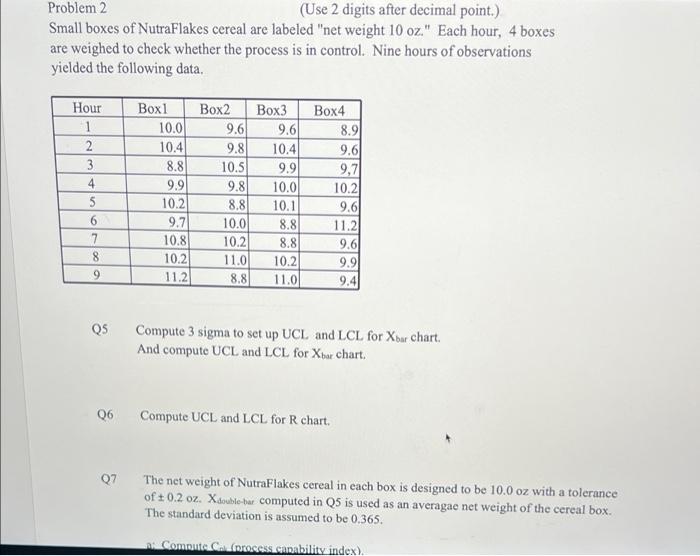
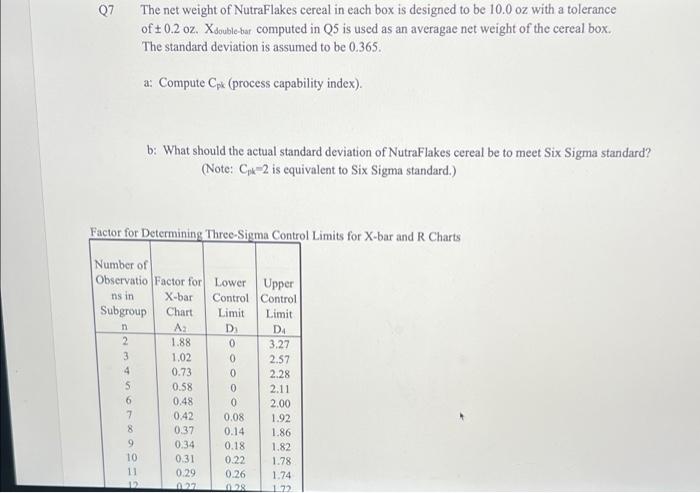
Question: Problem 2 (Use 2 digits after decimal point.) Small boxes of NutraFlakes cereal are labeled net weight 10 oz. Each hour, 4 boxes are weighed

Problem 2 (Use 2 digits after decimal point.)
Problem 2 (Use 2 digits after decimal point.) Small boxes of NutraFlakes cereal are labeled "net weight 10 oz." Each hour, 4 boxes are weighed to check whether the process is in control. Nine hours of observations yielded the following data. Box3 9.6 10.41 9.9 Hour 1 2 3 4 5 6 7 8 9 Box1 Box2 10.0 9.6 10.41 9.8 8.8 10.5 9.9 9.8 10.2 8.8 9.7 10.0 10.8 10.2 10.2 11.0 11.2 8.8 10.0 10.1 Box 4 8.91 9.6 9,71 10.2 9.6 11.21 9.6 9.90 9.4 8.8 8.8 10.2 11.0 QS Compute 3 sigma to set up UCL and LCL for Xoar chart. And compute UCL and LCL for Xbar chart. Q6 Compute UCL and LCL for R chart. 07 The net weight of NutraFlakes cereal in each box is designed to be 10.0 oz with a tolerance of +0.2 oz. Xablo bar computed in Q5 is used as an averagae net weight of the cereal box. The standard deviation is assumed to be 0.365. Comenta. (rocess capability index). 07 The net weight of NutraFlakes cereal in each box is designed to be 10.0 oz with a tolerance of +0.2 oz. Xdouble-bar computed in Q5 is used as an average net weight of the cereal box. The standard deviation is assumed to be 0.365. a: Compute Cpx (process capability index). b: What should the actual standard deviation of NutraFlakes cereal be to meet Six Sigma standard? (Note: Cyk-2 is equivalent to Six Sigma standard.) Factor for Determining Three-Sigma Control Limits for X-bar and R Charts ND Number of Observatio Factor for Lower Upper ns in X-bar Control Control Subgroup Chart Limit Limit Az D DA 2 1.88 0 3.27 3 1.02 0 2.57 4 0.73 0 2.28 5 0.58 0 2.11 6 0.48 0 2.00 7 0.42 0.08 1.92 8 0.37 0.14 1.86 9 0.34 0.18 1.82 10 0.31 0.22 1.78 11 0.29 0.26 1.74 028 172 ns in Number of Observatio Factor for Lower Upper X-bar Control Control Subgroup Chart Limit Limit n A2 D3 D4 2 1.88 0 3.27 3 1.02 0 2.57 4 0.73 0 2.28 5 0.58 0 2.11 6 0.48 0 2.00 7 0.42 0.08 1.92 8 0.37 0.14 1.86 9 0.34 0.18 1.82 10 0.31 0.22 1.78 11 0.29 0.26 1.74 12 0.27 0.28 1.72 13 0.25 0.31 1.69 14 0.33 1.67 15 0.22 0.35 1.65 16 0.21 0.36 1.64 17 0.20 0.38 1.62 18 0.19 0.39 1.61 19 0.19 0.40 20 0.18 0.41 1.59 0.24 1.60 Upper Control Limit UCL x-bar = Xdouble-bar + A2 Rbar Lower Control Limit LCL-bar= Xdouble-bar - A2 Rbar Upper Control Limit UCLR= D4Rbar

Step by Step Solution

There are 3 Steps involved in it

1 Expert Approved Answer
Step: 1 Unlock blur-text-image
Question Has Been Solved by an Expert!

Get step-by-step solutions from verified subject matter experts

Step: 2 Unlock
Step: 3 Unlock

Students Have Also Explored These Related General Management Questions!