

Question: Statistical Process Control Small boxes of NutraFlakes cereal are labeled net weight 10 ounces. Each hour, random samples of size n = 4 boxes are
Statistical Process Control
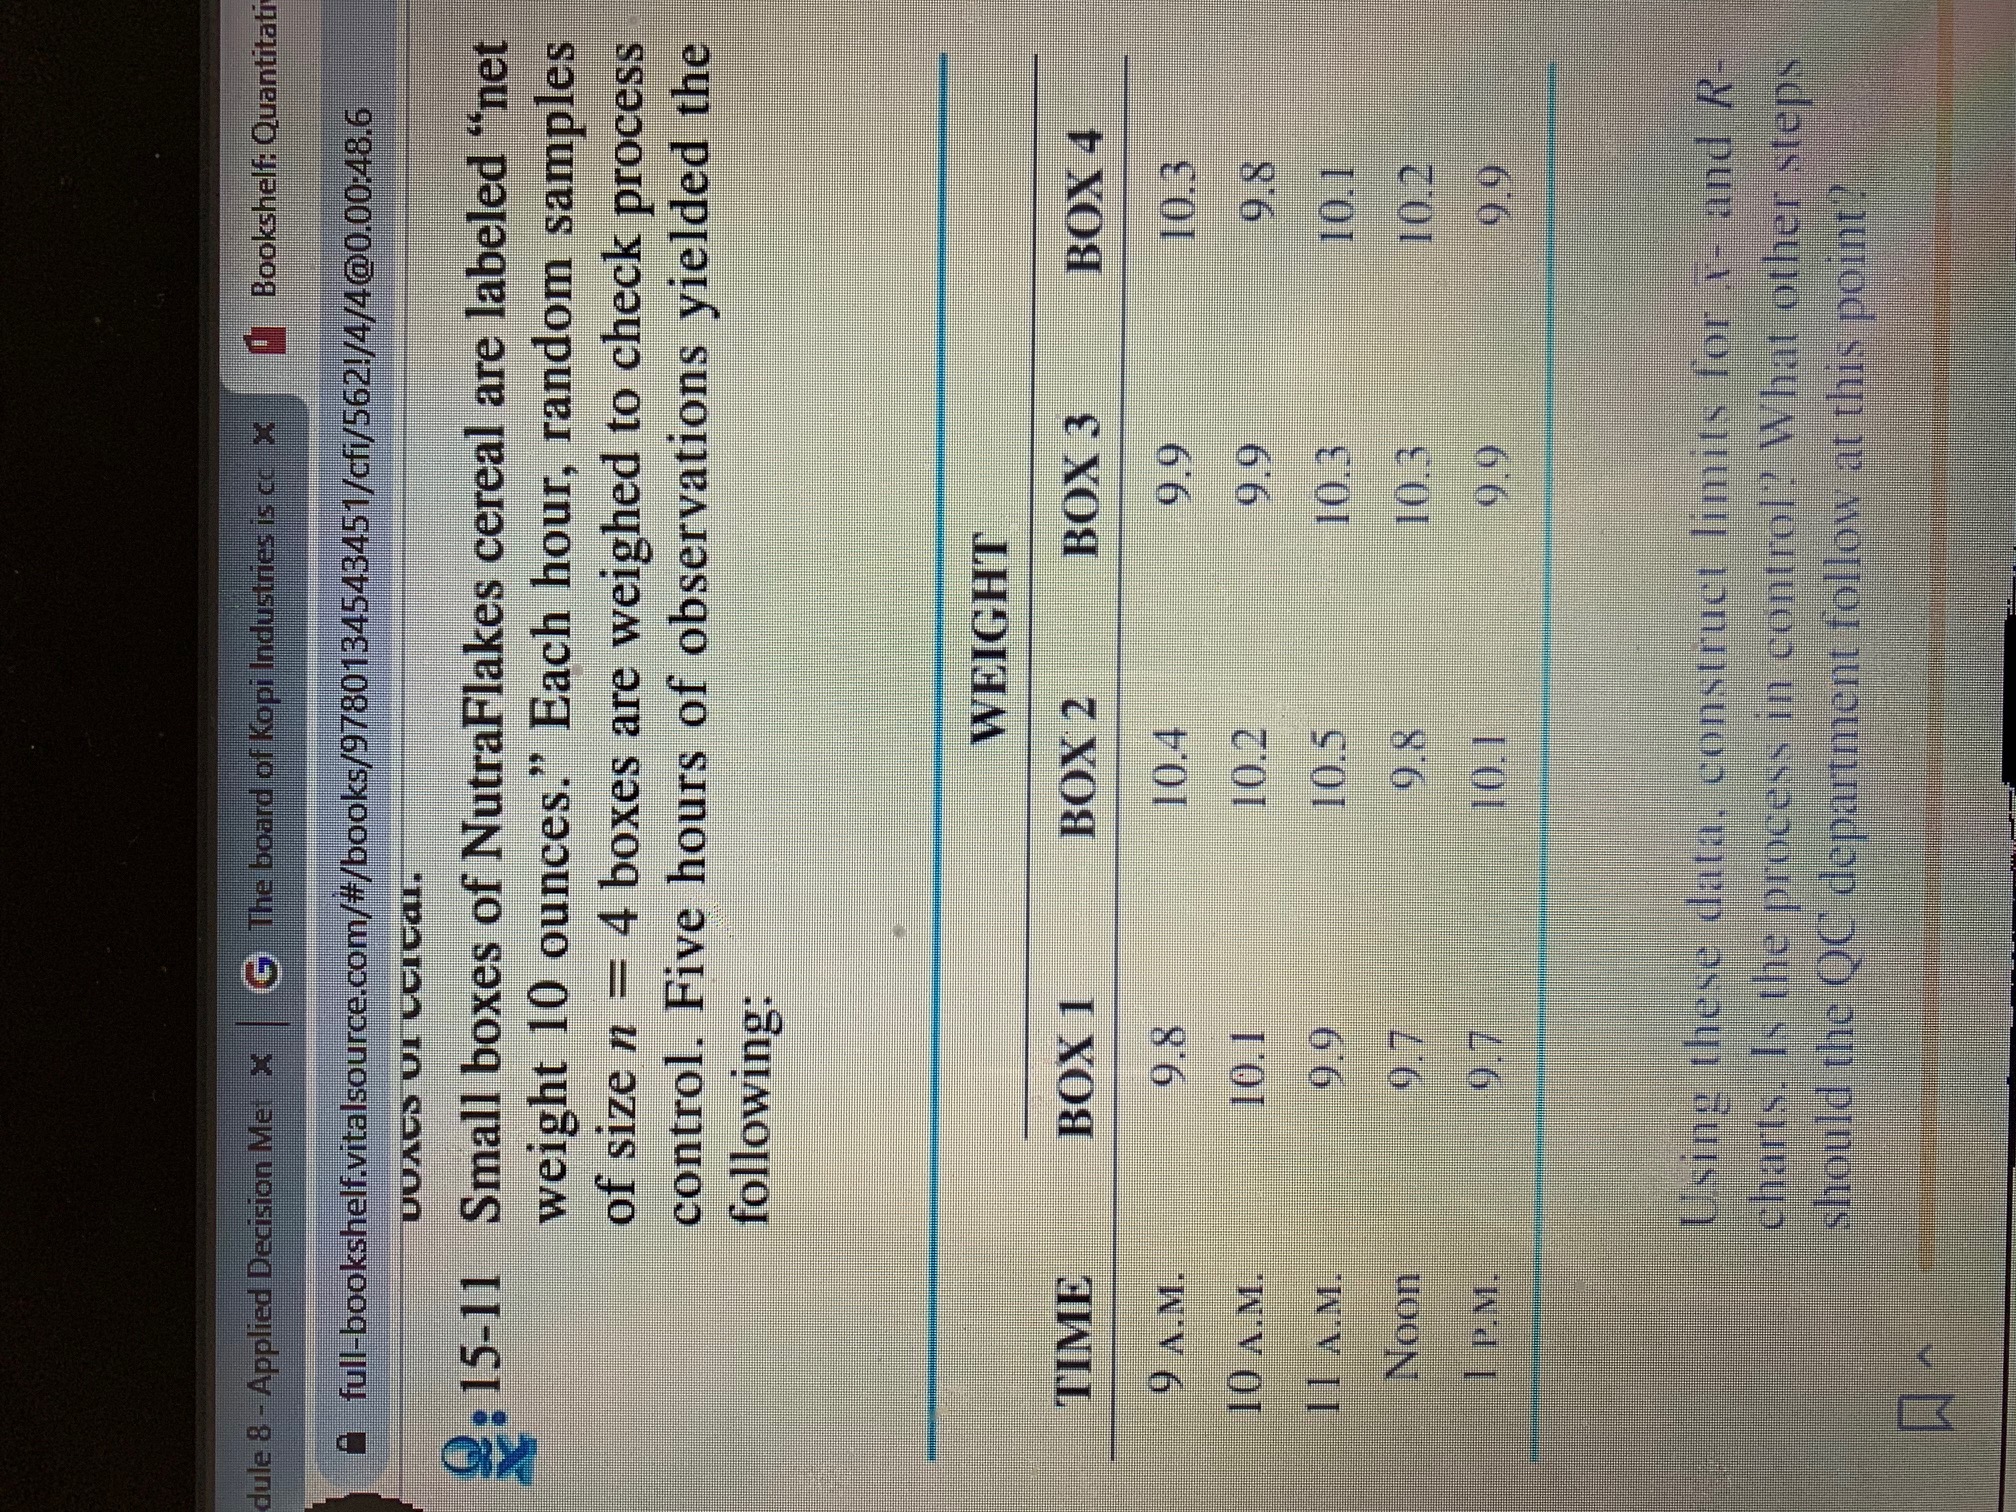
Small boxes of NutraFlakes cereal are labeled "net weight 10 ounces." Each hour, random samples of size n = 4 boxes are weighed to check process control. Five hours of observations yielded the following: WEIGHT TIME 9 a.m. 10 a.m. 11 a.m. Noon 1 p.m. BOX 1 9.8 10.1 9.9 9.7 9.7 BOX 2 10.4 10.2 10.5 9.8 10.1 BOX 3 9.9 9.9 10.3 10.3 9.9 BOX 4 10.3 9.8 10.1 10.2 9.9 Using these data, construct limits for x-and R-charts. Is the process in control? What other steps should the QC department follow at this point?
Please put in Excel QM if possible
dule 8 - Applied Decision Met x G The board of Kopi Industries Bookshelf: Quantitati "full-bookshelf.vitalsource.com/#/books/9780134543451/cfi/5621/4/4@0.00:48.6 UVACS VICCICaI. 2: 15-11 Small boxes of NutraFlakes cereal are labeled "net weight 10 ounces." Each hour, random samples of size n = 4 boxes are weighed to check process control. Five hours of observations yielded the following: WEIGHT TIME BOX 1 BOX 2 BOX 3 BOX 4 9 A.M. 9.8 10.4 9.9 10.3 10 A.M. 10.1 10.2 9.9 9.8 1 1 A.M 9.9 10.5 10.3 10.1 Noon 9.7 9.8 10.3 10.2 I P. M. 9.7 10.1 90 9.9 Using these data. construct limits for a- and R- charts. Is the process in control? What other steps should the QC department follow at this point
Step by Step Solution
There are 3 Steps involved in it

Get step-by-step solutions from verified subject matter experts