

Question: Problem 2 : Use MATLAB to draw the Bode plot of ( mathrm { G } ( mathrm { s } )
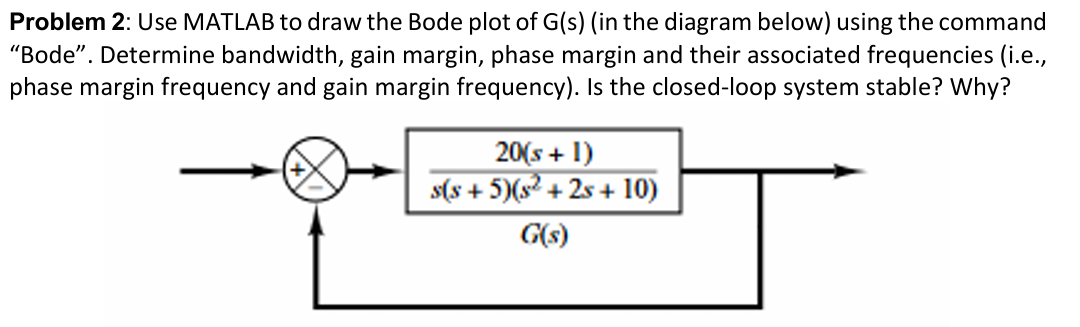
Problem : Use MATLAB to draw the Bode plot of mathrmGmathrmsin the diagram below using the command "Bode". Determine bandwidth, gain margin, phase margin and their associated frequencies ie phase margin frequency and gain margin frequency Is the closedloop system stable? Why?
Step by Step Solution
There are 3 Steps involved in it
1 Expert Approved Answer
Step: 1 Unlock

Question Has Been Solved by an Expert!
Get step-by-step solutions from verified subject matter experts
Step: 2 Unlock
Step: 3 Unlock