

Question: problem #2 worksheet. Problem 2: For the given data make a p chart. Show all your work and chart in the worksheet. Problem 3: A
problem #2
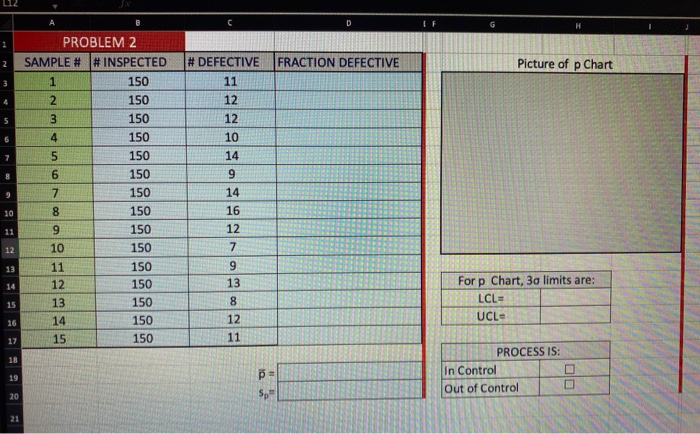
worksheet. Problem 2: For the given data make a p chart. Show all your work and chart in the worksheet. Problem 3: A network diagram for a project is shown. Three time estimates (a, m, b) are provided for activities A, B, C, D, E, and F. Find the proiect completion time (PCT the standard A B C D CF H 1 FRACTION DEFECTIVE Picture of p Chart # DEFECTIVE 11 12 12 10 14 9 PROBLEM 2 SAMPLE # # INSPECTED 1 150 2 150 3 150 4 150 5 150 6 150 7 150 8 150 9 150 10 150 11 150 12 150 13 150 14 150 15 150 10 14 16 12 7 11 12 13 9 13 14 For p Chart, 3o limits are: LCL UCL- 15 8 16 12 11 17 18 PROCESS IS: In Control Out of Control 19 Sp" OD 20 21
Step by Step Solution
There are 3 Steps involved in it
1 Expert Approved Answer
Step: 1 Unlock

Question Has Been Solved by an Expert!
Get step-by-step solutions from verified subject matter experts
Step: 2 Unlock
Step: 3 Unlock