

Question: problem 1: for the given data make X and R charts. show all of your work and the charts in the worksheet. Problem 1: For
problem 1: for the given data make X and R charts. show all of your work and the charts in the worksheet.
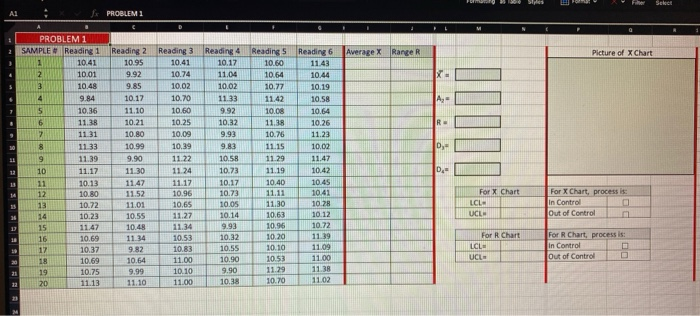
Problem 1: For the given data make X and R charts. Show all your work and the charts in the worksheet. Siples 18 Sekt Al PROBLEMI Average X Range R Picture of x Chart x A- R 30 D, PROBLEM 1 SAMPLE Reading 1 1 10.41 2 10.01 3 10.48 9.84 5 10.36 6 11.38 11 31 8 1133 9 11.39 10 11.17 11 10.13 12 10.80 13 10.72 14 10.23 15 11.47 16 10.69 17 10.37 18 10.69 19 10.75 20 11.13 Reading 2 10.95 9.92 9.85 10.17 11.10 10.21 10.80 10.99 9.90 11 30 11.47 11.52 11.01 10.55 10.48 11.34 9.82 10.64 9.99 11.10 Reading 3 10.41 10.74 10.02 10.70 10.60 10.25 10.09 10,39 11.22 11.24 11.12 10.96 10.65 11.27 11.34 10.53 10.83 11.00 10.10 11.00 Reading 4 10.17 11.04 10.02 11.33 9.92 10.32 9.93 9.83 10.58 10.73 10.17 10.73 10.05 10.14 9.93 10.32 10.55 10.90 9.90 10.38 Readings 10.60 10.64 10.77 11.42 10.08 11.38 10.76 11.15 11.29 11.19 10.40 11.11 11.30 10.63 10.96 10.20 10.10 10:53 11.23 10.70 Reading 6 11.43 10.44 10.19 10.58 10.64 10.26 11.23 10.02 11.47 10.42 10.45 10.41 10.28 10.12 10.72 11 39 11.09 11.00 11.38 11.02 D. 13 For X Chart LCL UCL For X Chart, process is in Control Out of Control 25 For R Chart LCL UCL For R Chart, process is: in Control Out of Control 21 22 M Step by Step Solution
There are 3 Steps involved in it
1 Expert Approved Answer
Step: 1 Unlock

Question Has Been Solved by an Expert!
Get step-by-step solutions from verified subject matter experts
Step: 2 Unlock
Step: 3 Unlock