

Question: PROBLEM 2.4 Note: The text incorrectly labeled the column headings for 2009 and 2010. This solution has corrected the labels. Solution Legend Value given in
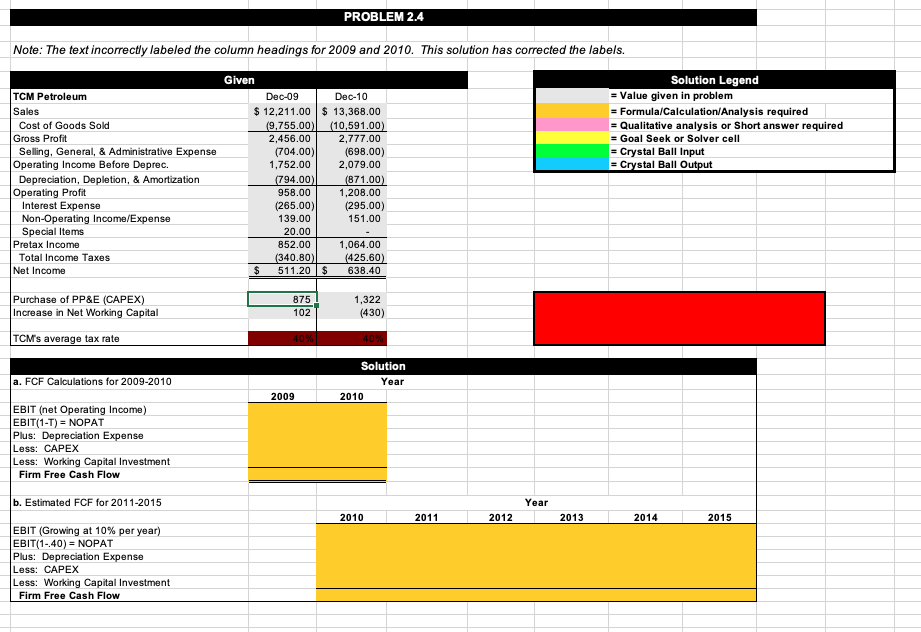
PROBLEM 2.4 Note: The text incorrectly labeled the column headings for 2009 and 2010. This solution has corrected the labels. Solution Legend Value given in problem = Formula/Calculation/Analysis required = Qualitative analysis or Short answer required = Goal Seek or Solver cell = Crystal Ball Input = Crystal Ball Output TCM Petroleum Sales Cost of Goods Sold Gross Profit Selling, General, & Administrative Expense Operating Income Before Deprec. Depreciation, Depletion, & Amortization Operating Profit Interest Expense Non-Operating Income/Expense Special Items Pretax Income Total Income Taxes Net Income Given Dec-09 Dec-10 $ 12,211.00 $ 13,368.00 (9,755.00) (10,591.00) 2,456.00 2,777.00 (704.00) (698.00) 1,752.00 2,079.00 (794.00) (871.00) 958.00 1,208.00 (265.00) (295.00) 139.00 151.00 20.00 852.00 1,064.00 (340.80) (425.60) $ 511.20$ 638.40 875 102 1,322 (430) Purchase of PP&E (CAPEX) Increase in Net Working Capital TCM's average tax rate 40% 40% FCF Calculations for 2009-2010 Solution Year 2010 2009 EBIT (net Operating Income) EBIT(1-T) = NOPAT Plus: Depreciation Expense Less: CAPEX Less: Working Capital Investment Firm Free Cash Flow b. Estimated FCF for 2011-2015 Year 2010 2011 2012 2013 2014 2015 EBIT (Growing at 10% per year) EBIT(1.40) = NOPAT Plus: Depreciation Expense Less: CAPEX Less: Working Capital Investment Firm Free Cash Flow
Step by Step Solution
There are 3 Steps involved in it

Get step-by-step solutions from verified subject matter experts