

Question: Problem 2.53 (Page 87) 2.53 The following data represent the amount of soft drink filled in a subgroup of 50 consecutive two-liter bottles. The results
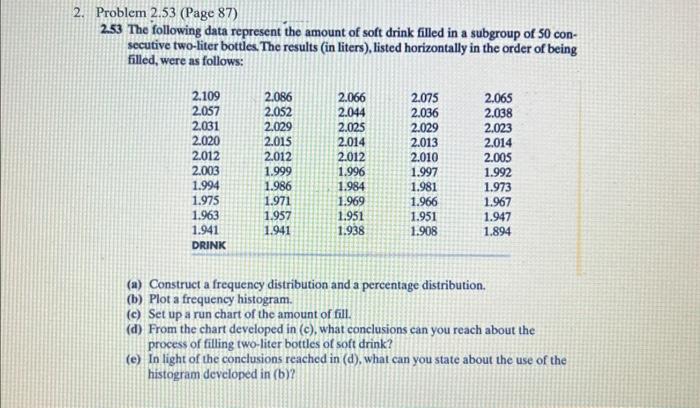
Problem 2.53 (Page 87) 2.53 The following data represent the amount of soft drink filled in a subgroup of 50 consecutive two-liter bottles. The results (in liters), listed horizontally in the order of being filled, were as follows: (a) Construct a frequency distribution and a percentage distribution. (b) Plot a frequency histogram. (c) Set up a run chart of the amount of fill. (d) From the chart developed in (c), what conclusions can you reach about the process of filling two-liter bottles of soft drink? (e) In light of the conclusions reached in (d), what can you state about the use of the histogram developed in (b)
Step by Step Solution
There are 3 Steps involved in it
1 Expert Approved Answer
Step: 1 Unlock

Question Has Been Solved by an Expert!
Get step-by-step solutions from verified subject matter experts
Step: 2 Unlock
Step: 3 Unlock