

Question: Problem 3 ( 1 0 points ) . The following table shows a test result of a classifier on a dataset. table [ [
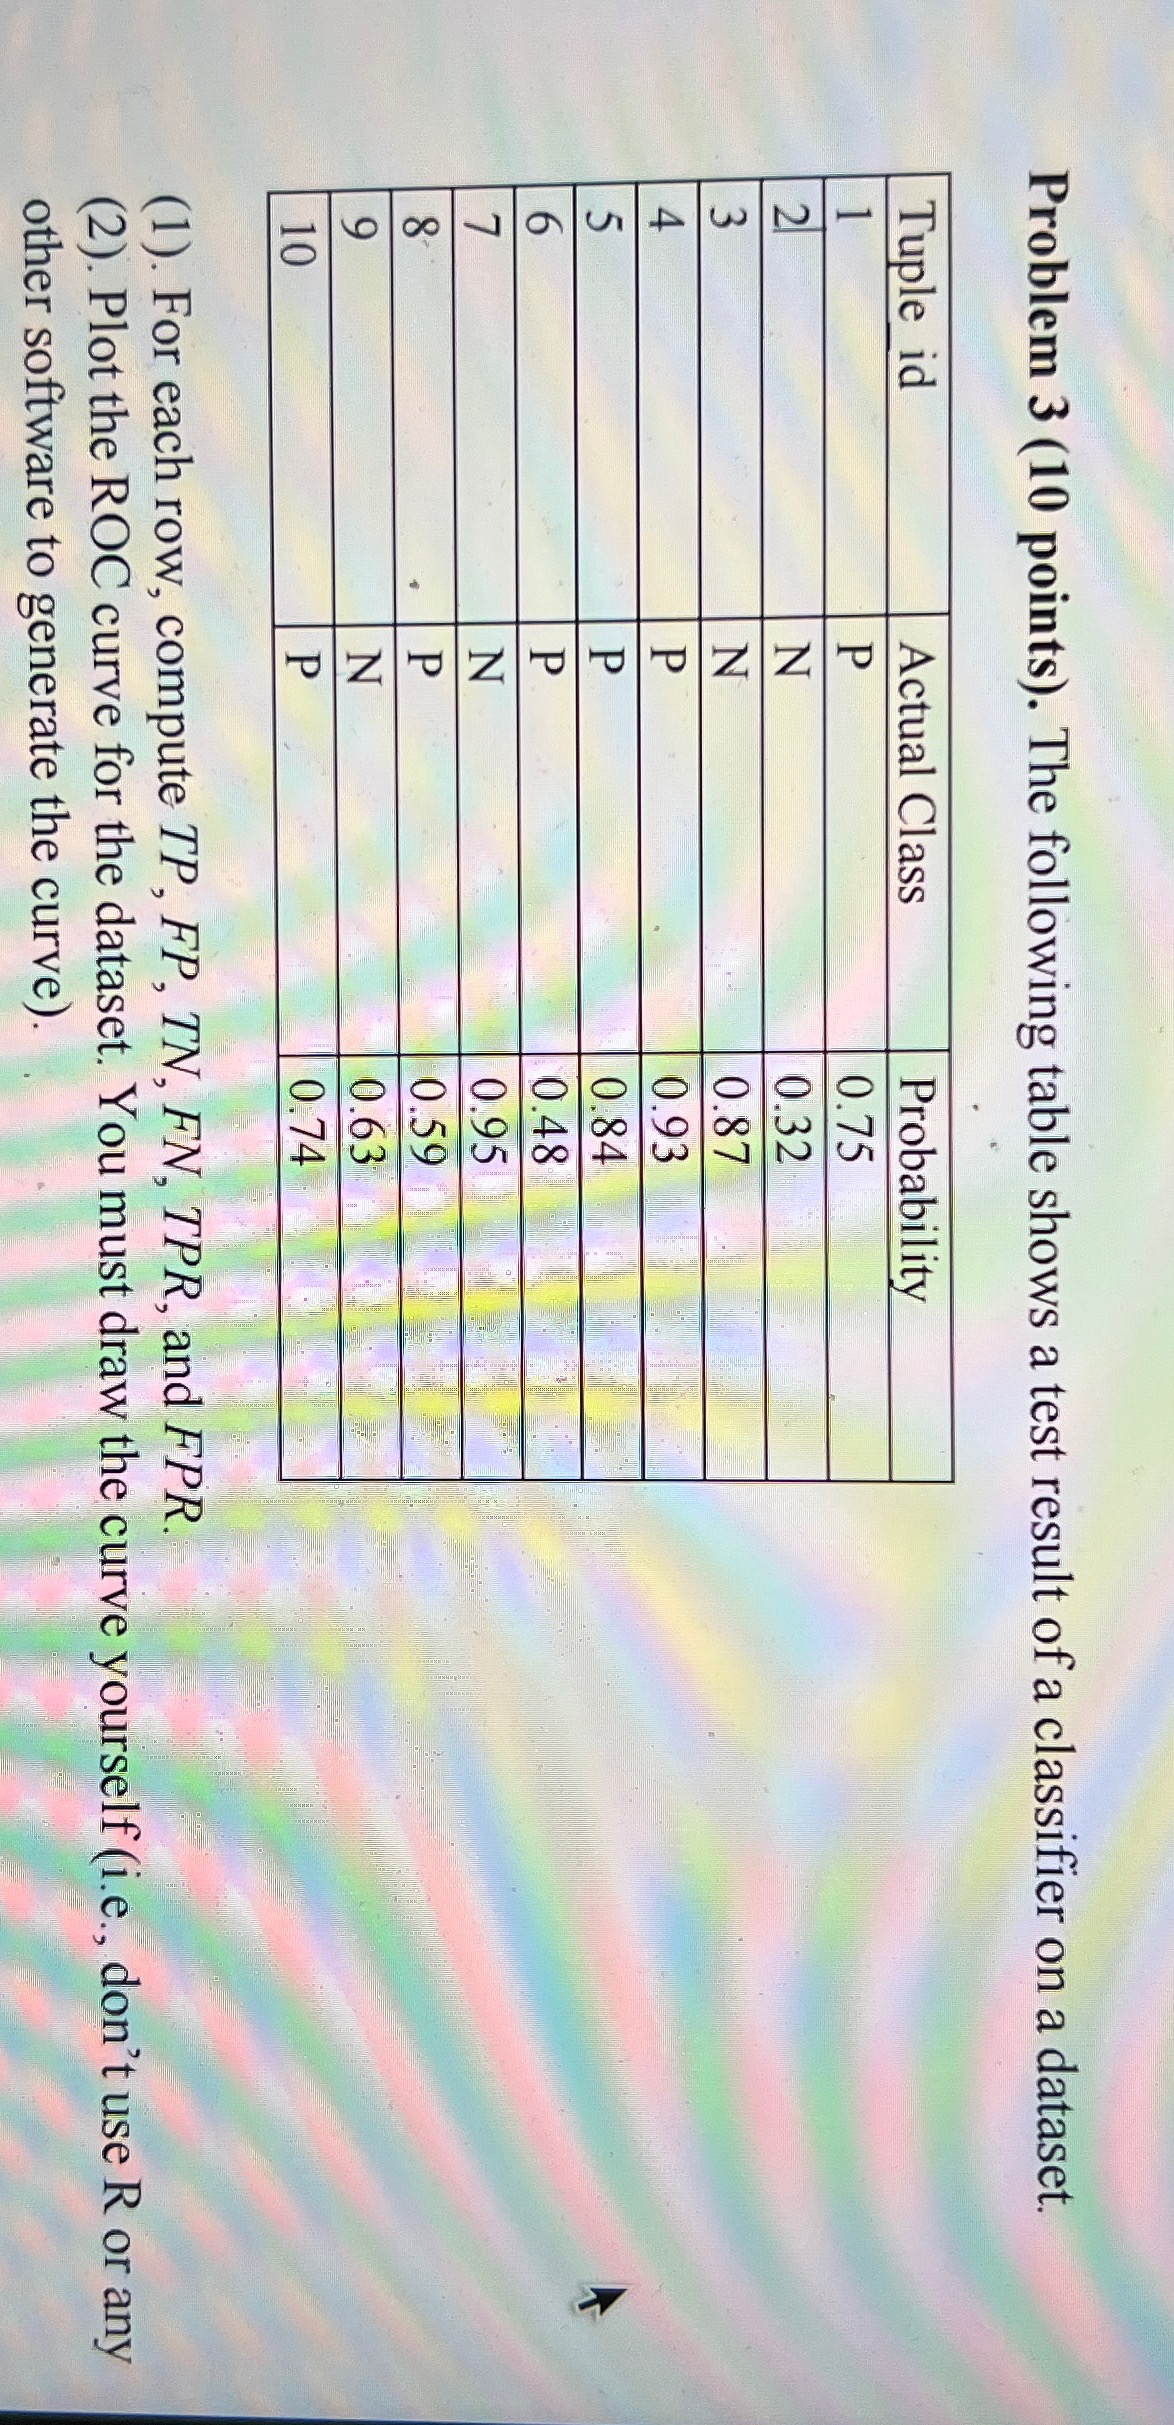
Problem points The following table shows a test result of a classifier on a dataset.
tableTuple idActual Class,ProbabilityPNNPPPNPNP
For each row, compute and
Plot the ROC curve for the dataset. You must draw the curve yourself ie don't use R or any other software to generate the curve
Step by Step Solution
There are 3 Steps involved in it
1 Expert Approved Answer
Step: 1 Unlock

Question Has Been Solved by an Expert!
Get step-by-step solutions from verified subject matter experts
Step: 2 Unlock
Step: 3 Unlock