

Question: Problem 3 (10 points). The following table shows a test result of a classifier on a dataset. Tuple id Actual Class Probability 1 P 0.82
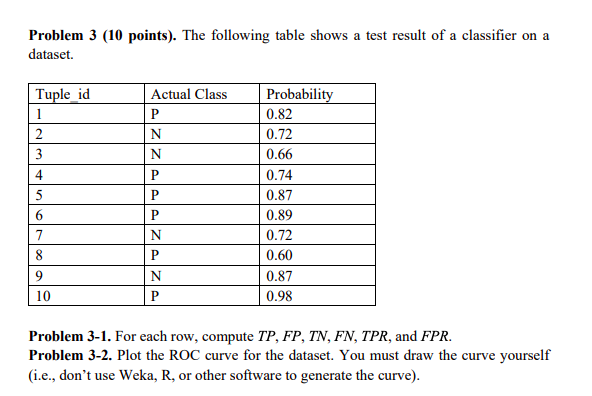
Problem 3 (10 points). The following table shows a test result of a classifier on a dataset. Tuple id Actual Class Probability 1 P 0.82 2 N 0.72 WJ N 0.66 4 P 0.74 P 0.87 6 P 0.89 7 N 0.72 8 P 0.60 9 N 0.87 10 P 0.98 Problem 3-1. For each row, compute TP, FP, TN, FN, TPR, and FPR. Problem 3-2. Plot the ROC curve for the dataset. You must draw the curve yourself (i.e., don't use Weka, R, or other software to generate the curve)
Step by Step Solution
There are 3 Steps involved in it
1 Expert Approved Answer
Step: 1 Unlock

Question Has Been Solved by an Expert!
Get step-by-step solutions from verified subject matter experts
Step: 2 Unlock
Step: 3 Unlock