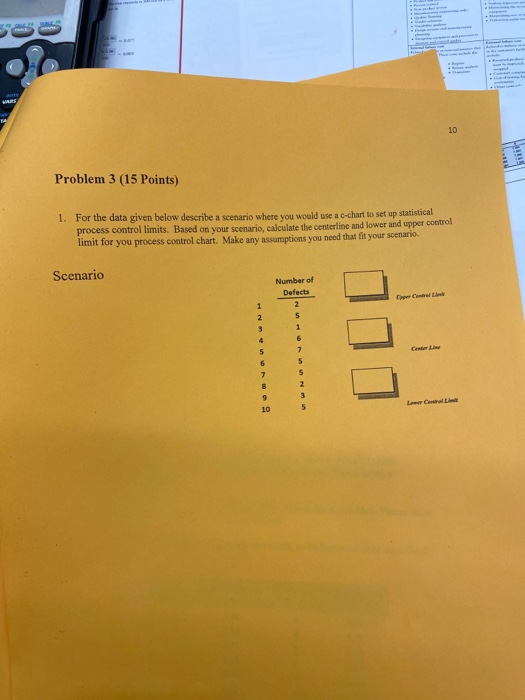
Question: Problem 3 (15 Points) 1. For the data given below describe a scenario where you would use a c-chart to set up statistical process control

Problem 3 (15 Points) 1. For the data given below
Problem 3 (15 Points) 1. For the data given below describe a scenario where you would use a c-chart to set up statistical process control limits. Based on your scenario, calculate the centerline and lower and upper control limit for you process control chart. Make any assumptions you need that fit your scenario. Scenario Number of Defects OU

Step by Step Solution

There are 3 Steps involved in it

1 Expert Approved Answer
Step: 1 Unlock blur-text-image
Question Has Been Solved by an Expert!

Get step-by-step solutions from verified subject matter experts

Step: 2 Unlock
Step: 3 Unlock

Students Have Also Explored These Related General Management Questions!