

Question: Plastic bottles for liquid laundry detergent are formed by blow molding. Twenty samples of n = 100 bottles are inspected in time order of production,
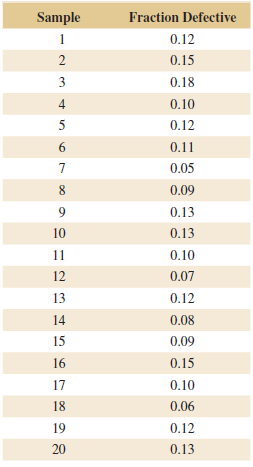
Plastic bottles for liquid laundry detergent are formed by blow molding. Twenty samples of n = 100 bottles are inspected in time order of production, and the fraction defective in each sample is reported. The data are as follows:
(a) Set up a P chart for this process. Is the process in statistical control?
(b) Suppose that instead of n = 100, n = 200. Use the data given to set up a P chart for this process. Revise the control limits if necessary.
(c) Compare your control limits for the P charts in parts (a) and (b). Explain why they differ. Also, explain why your assessment about statistical control differs for the two sizes of n.
Sample Fraction Defective 0.12 1 0.15 2 0.18 3 4 0.10 0.12 6. 0.11 0.05 0.09 8. 0.13 10 0.13 11 0.10 12 0.07 13 0.12 14 0.08 15 0.09 16 0.15 17 0.10 18 0.06 0.12 19 20 0.13
Step by Step Solution
3.46 Rating (159 Votes )
There are 3 Steps involved in it
a There are no points beyond the control limits The p... View full answer

Get step-by-step solutions from verified subject matter experts