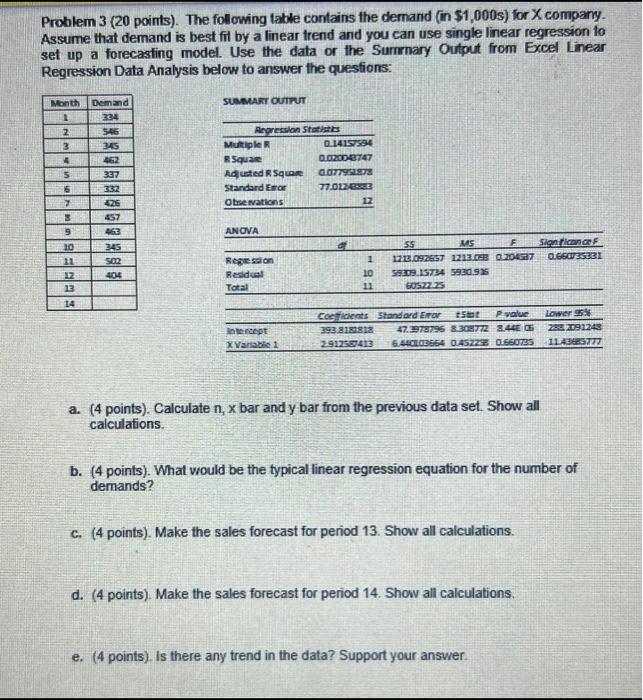
Question: Problem 3 (20 points). The following table contains the demand (in $1,000s) for X company. Assume that demand is best fit by a linear trend

Problem 3 (20 points). The following table
Problem 3 (20 points). The following table contains the demand (in $1,000s) for X company. Assume that demand is best fit by a linear trend and you can use single linear regression to set up a forecasting model. Use the data or the Summary Output from Excel Linear Regression Data Analysis below to answer the questions: Month SUMMARY OUTPUT 1 2 Demand 234 546 345 462 337 332 426 457 463 345 SO 404 Regression States Multiple 0.14151594 Square 0.02000747 Ad usted R Square G.07796197 Standard Efor 77.0L2BE3 Observations 12 NMMUNAAN ANOVA 10 11 Sign in 0.660 35331 1 55 MS F 122.092EST 1213.03 204687 59209.15734 5830.93 GOS22 25 Regression Besidual Total 17 20 11 Intercept X Variable 1 Coeficients Standard Error Star P value 293.213 47. 378796 8:308772 2.4 G 2.937597413 6.44CLOB664 QAS229 0.660735 Lower 208. 2091243 1LBSTZ a. (4 points). Calculate n, x bar and y bar from the previous data set. Show all calculations. b. (4 points). What would be the typical linear regression equation for the number of demands? C. (4 points). Make the sales forecast for period 13. Show all calculations. d. (4 points). Make the sales forecast for period 14. Show all calculations, e. (4 points). Is there any trend in the data? Support your

Step by Step Solution

There are 3 Steps involved in it

1 Expert Approved Answer
Step: 1 Unlock blur-text-image
Question Has Been Solved by an Expert!

Get step-by-step solutions from verified subject matter experts

Step: 2 Unlock
Step: 3 Unlock

Students Have Also Explored These Related General Management Questions!