

Question: Problem #3 (20 points total) a) Given the expected returns, standard deviation of returns and correlation matrix for stocks A, B and C (shaded in
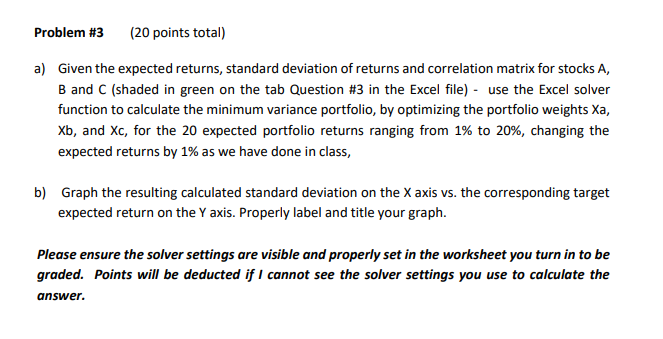
Problem #3 (20 points total) a) Given the expected returns, standard deviation of returns and correlation matrix for stocks A, B and C (shaded in green on the tab Question #3 in the Excel file) - use the Excel solver function to calculate the minimum variance portfolio, by optimizing the portfolio weights Xa, Xb, and Xc, for the 20 expected portfolio returns ranging from 1% to 20%, changing the expected returns by 1% as we have done in class, b) Graph the resulting calculated standard deviation on the X axis vs. the corresponding target expected return on the Y axis. Properly label and title your graph. Please ensure the solver settings are visible and properly set in the worksheet you turn in to be graded. Points will be deducted if I cannot see the solver settings you use to calculate the answer. Problem #3 (20 points total) a) Given the expected returns, standard deviation of returns and correlation matrix for stocks A, B and C (shaded in green on the tab Question #3 in the Excel file) - use the Excel solver function to calculate the minimum variance portfolio, by optimizing the portfolio weights Xa, Xb, and Xc, for the 20 expected portfolio returns ranging from 1% to 20%, changing the expected returns by 1% as we have done in class, b) Graph the resulting calculated standard deviation on the X axis vs. the corresponding target expected return on the Y axis. Properly label and title your graph. Please ensure the solver settings are visible and properly set in the worksheet you turn in to be graded. Points will be deducted if I cannot see the solver settings you use to calculate the
Step by Step Solution
There are 3 Steps involved in it

Get step-by-step solutions from verified subject matter experts