

Question: Problem 3: (25) Given: Project activity budgets are given with probability distributions and parameters given in the table below. Find: (Show all calculations) Run a
Problem 3: (25)
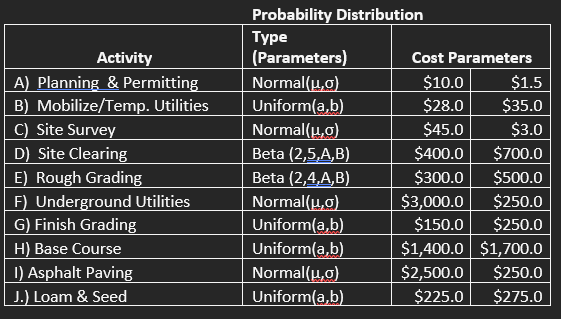
Given: Project activity budgets are given with probability distributions and parameters given in the table below.
Find: (Show all calculations)
- Run a Monte Carlo simulation of total cost using the above probability distributions and 30 runs. Plot the Histogram and cumulative distribution of total cost based on the simulation results.
- Based on the simulation results and assuming that total project cost is normally distributed, Determine the following:
- Expected Cost
- Standard Deviation of Cost
- The probability that total project cost will exceed $8,500K
Probability Distribution \begin{tabular}{|l|l|r|r|} \hline \multicolumn{1}{|c|}{ Activity } & \multicolumn{1}{|l|}{Type(Parameters)} & \multicolumn{2}{c|}{ Cost Parameters } \\ \hline A) Planning \& Permitting & Normal (,) & $10.0 & $1.5 \\ \hline B) Mobilize/Temp. Utilities & Uniform (a,b) & $28.0 & $35.0 \\ \hline C) Site Survey & Normal (,) & $45.0 & $3.0 \\ \hline D) Site Clearing & Beta (2,5,A,B) & $400.0 & $700.0 \\ \hline E) Rough Grading & Beta(2,4,A,B) & $300.0 & $500.0 \\ \hline F) Underground Utilities & Normal (,) & $3,000.0 & $250.0 \\ \hline G) Finish Grading & Uniform (a,b) & $150.0 & $250.0 \\ \hline H) Base Course & Uniform(a,b) & $1,400.0 & $1,700.0 \\ \hline I) Asphalt Paving & Normal (,) & $2,500.0 & $250.0 \\ \hline J.) Loam \& Seed & Uniform (a,b) & $225.0 & $275.0 \\ \hline \end{tabular}
Step by Step Solution
There are 3 Steps involved in it

Get step-by-step solutions from verified subject matter experts