

Question: Problem #3 (4 points) Study the Pareto diagram below, which shows the sources of medication errors in hospitals. Then answer the questions below. Clue: The
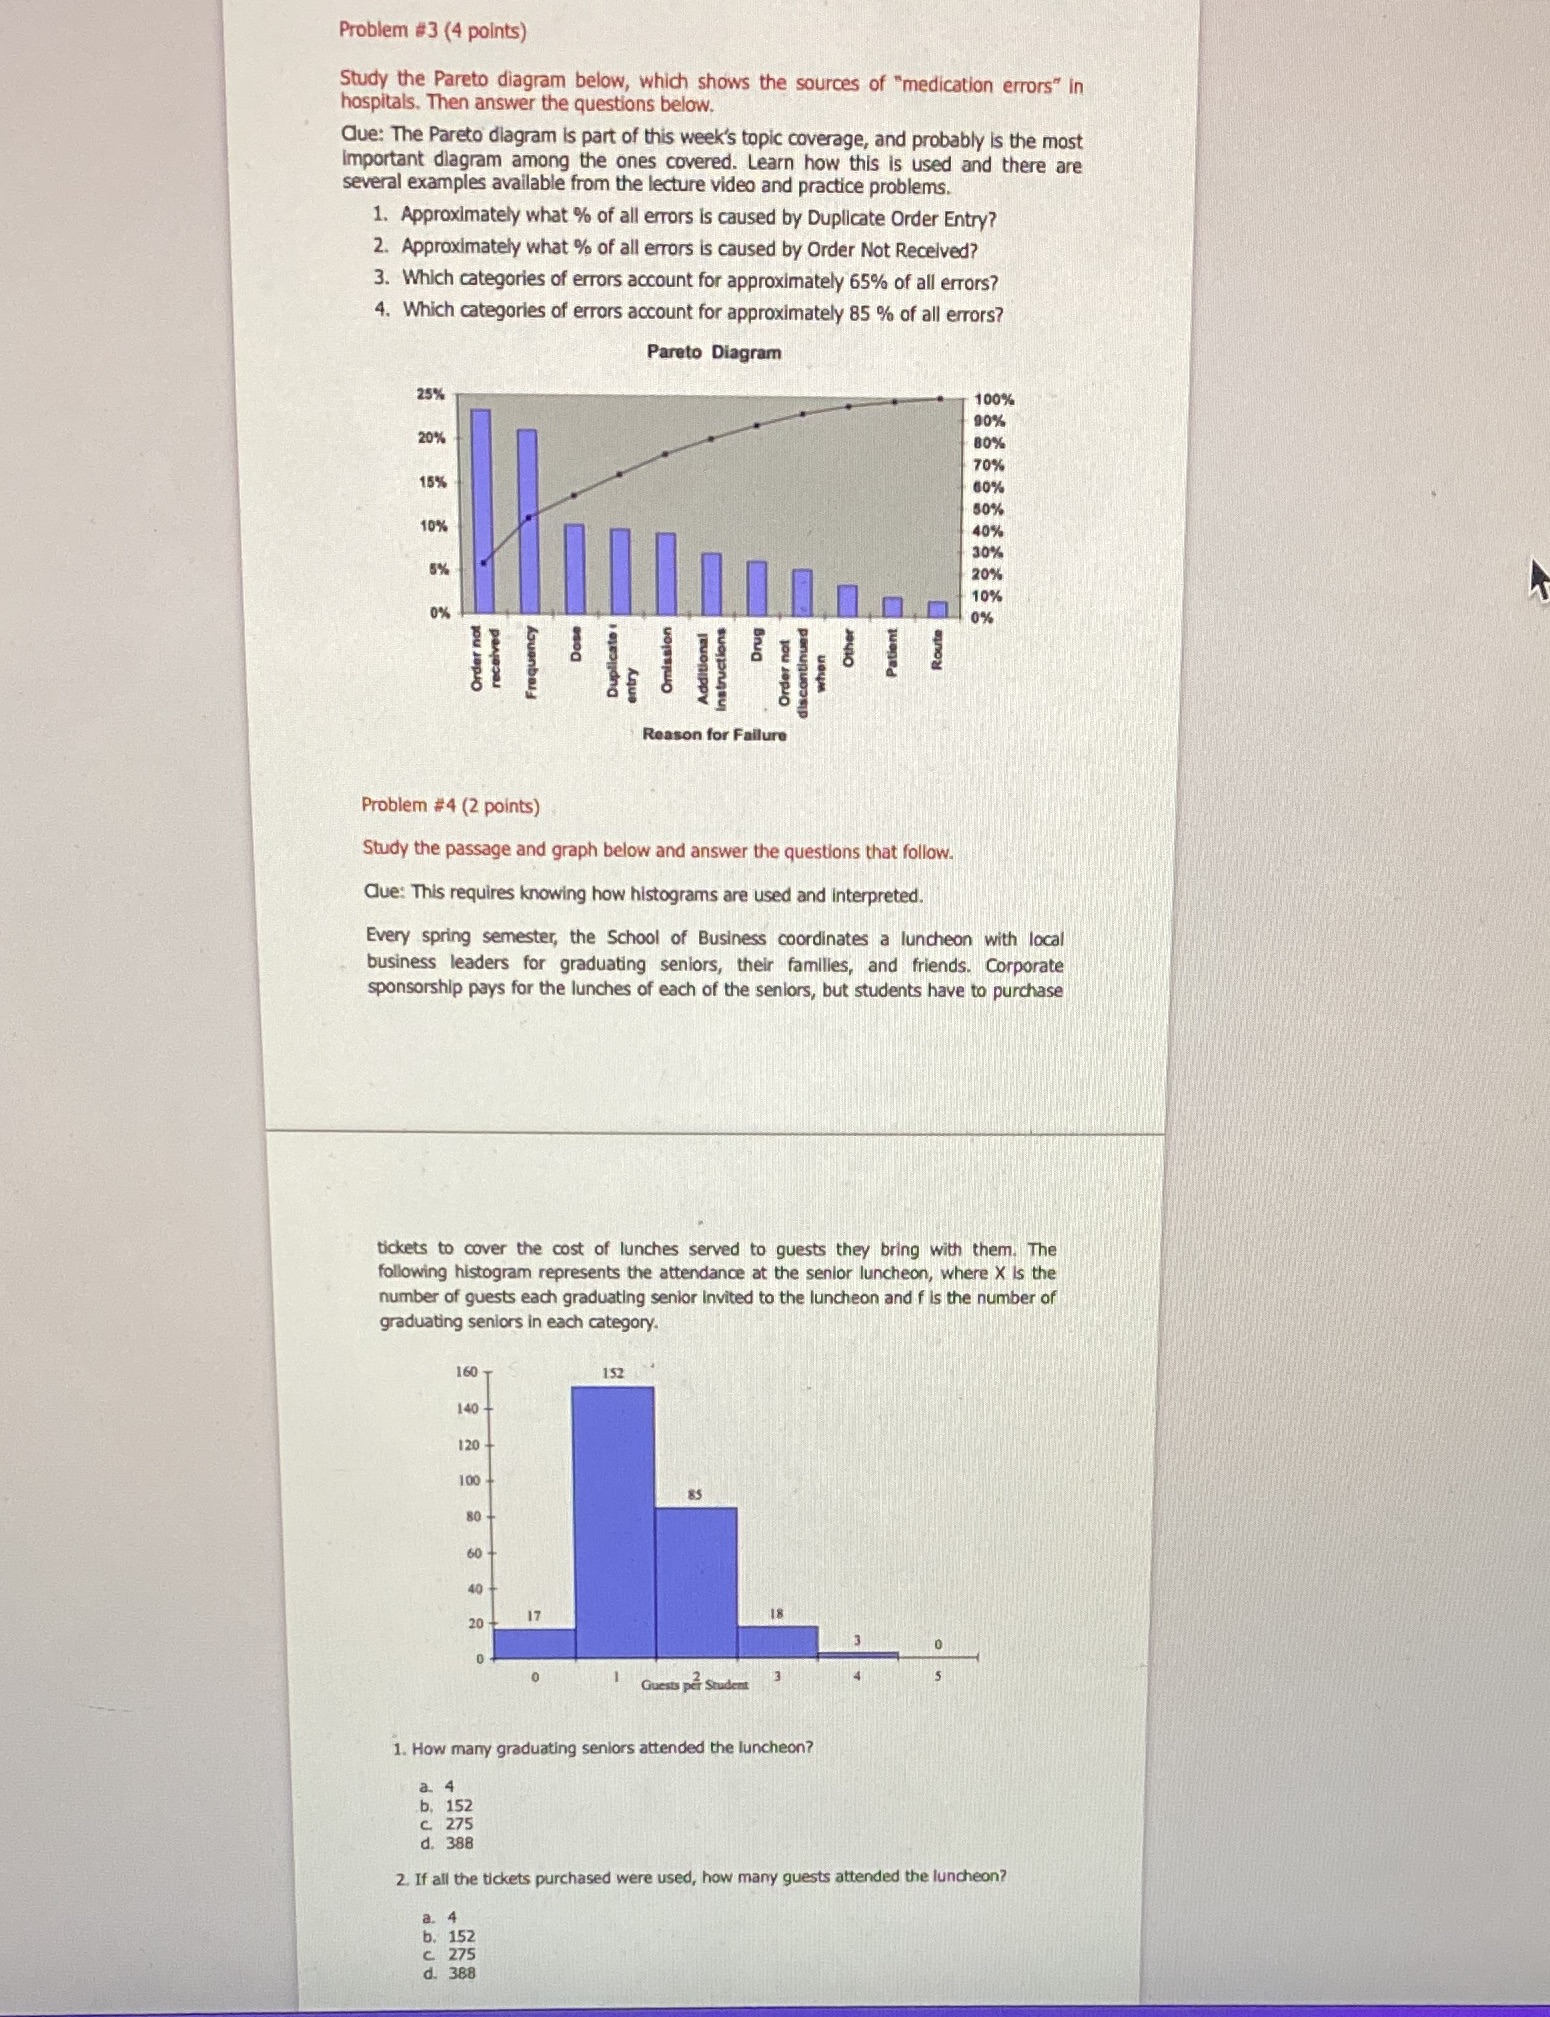
Problem #3 (4 points) Study the Pareto diagram below, which shows the sources of "medication errors" in hospitals. Then answer the questions below. Clue: The Pareto diagram is part of this week's topic coverage, and probably is the most Important diagram among the ones covered. Learn how this is used and there are several examples available from the lecture video and practice problems. 1. Approximately what % of all errors is caused by Duplicate Order Entry? 2. Approximately what % of all errors is caused by Order Not Received? 3. Which categories of errors account for approximately 65% of all errors? 4. Which categories of errors account for approximately 85 % of all errors? Pareto Diagram 25% 100% 90% 20% 80% 70% 15%% 60% 50% 40% 30% 20%% 0% 10% Reason for Failure Problem #4 (2 points) Study the passage and graph below and answer the questions that follow. Clue: This requires knowing how histograms are used and interpreted. Every spring semester, the School of Business coordinates a luncheon with local business leaders for graduating seniors, their families, and friends. Corporate sponsorship pays for the lunches of each of the seniors, but students have to purchase tickets to cover the cost of lunches served to guests they bring with them. The following histogram represents the attendance at the senior luncheon, where X is the number of guests each graduating senior Invited to the luncheon and f is the number of graduating seniors in each category. 160 152 140 120 100 8 8 20 17 18 1 Guests pa Student 1. How many graduating seniors attended the luncheon? 4 b. 152 C. 275 388 2. If all the tickets purchased were used, how many guests attended the luncheon? 152 C 2 d
Step by Step Solution
There are 3 Steps involved in it

Get step-by-step solutions from verified subject matter experts