

Question: Problem 3 (a) x and R charts with n = 9 are used to monitor a normally distributed quality characteristic. The control chart parameters are,
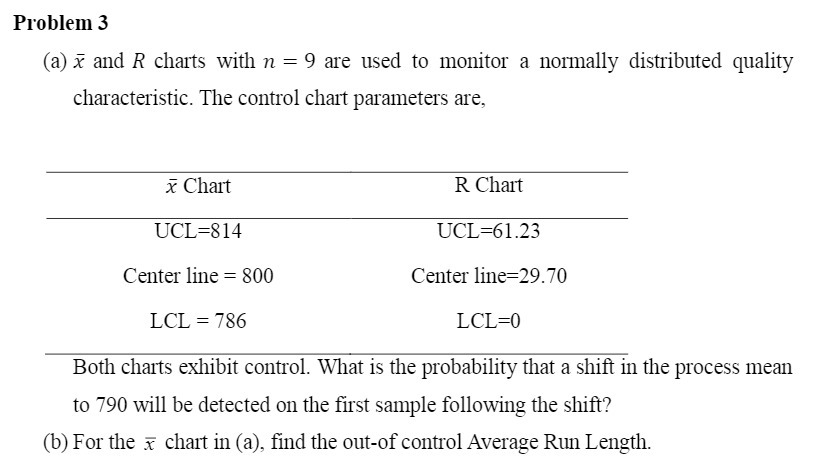
Problem 3 (a) x and R charts with n = 9 are used to monitor a normally distributed quality characteristic. The control chart parameters are, x Chart R Chart UCL=814 UCL=61.23 Center line = 800 Center line=29.70 LCL = 786 LCL=0 Both charts exhibit control. What is the probability that a shift in the process mean to 790 will be detected on the first sample following the shift? (b) For the x chart in (a), find the out-of control Average Run Length
Step by Step Solution
There are 3 Steps involved in it
1 Expert Approved Answer
Step: 1 Unlock

Question Has Been Solved by an Expert!
Get step-by-step solutions from verified subject matter experts
Step: 2 Unlock
Step: 3 Unlock