

Question: answer these questions showing the steps 3. A normally distributed quality characteristic is controlled by x and R charts having the following parameters (n -
answer these questions showing the steps
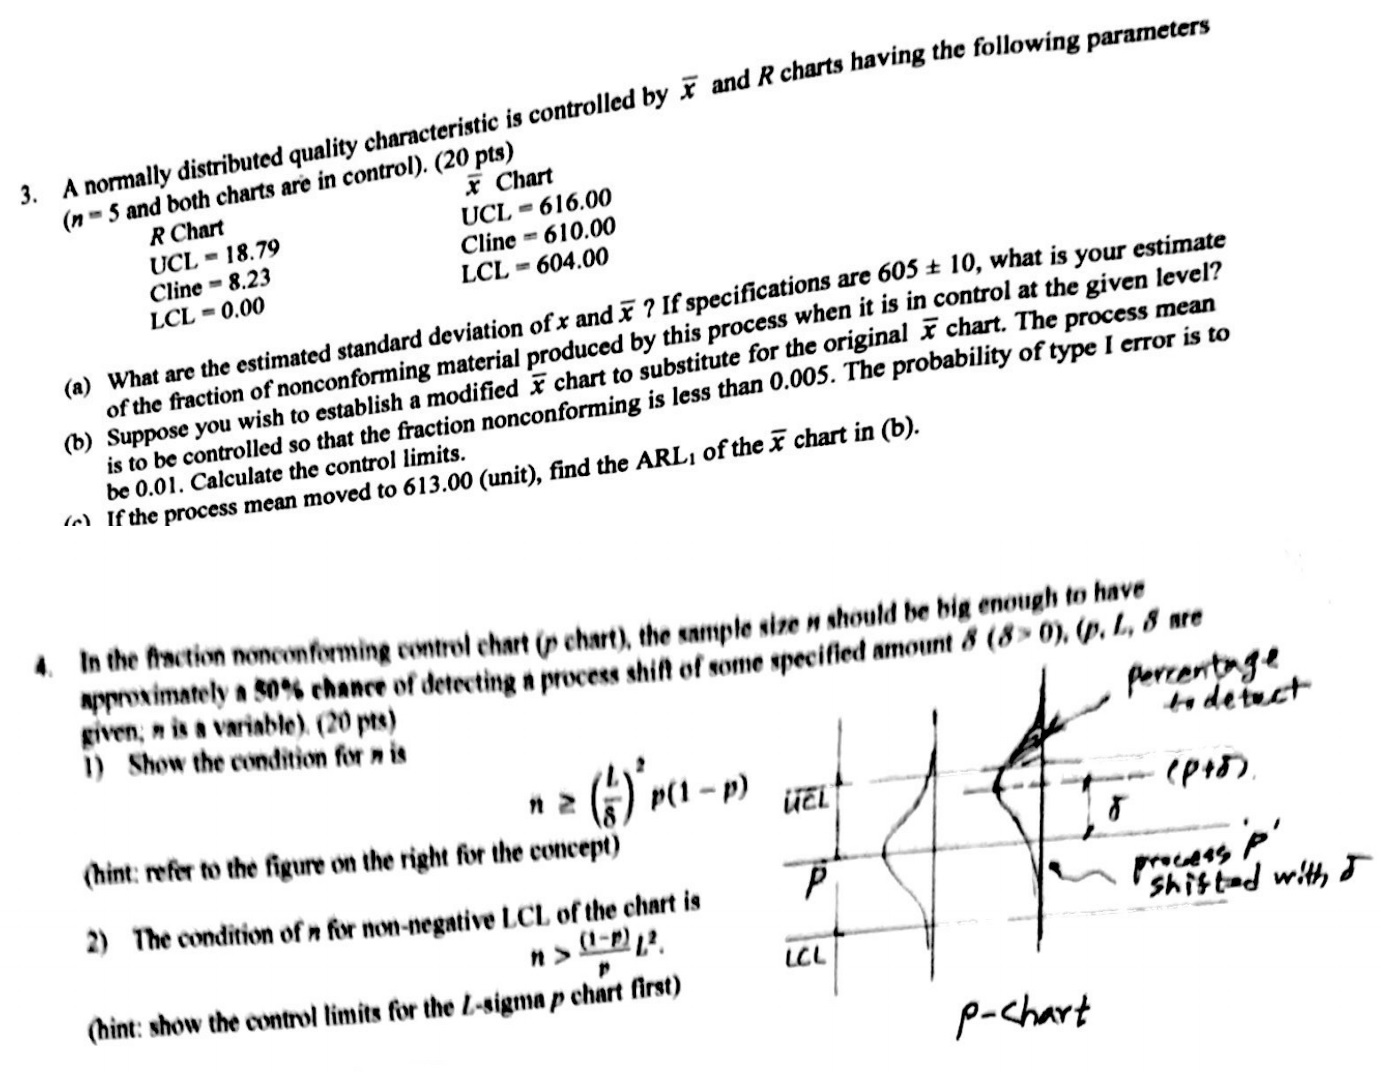
3. A normally distributed quality characteristic is controlled by x and R charts having the following parameters (n - 5 and both charts are in control). (20 pts) R Chart x Chart UCL - 18.79 UCL - 616.00 Cline - 8.23 Cline = 610.00 LCL = 0.00 LCL - 604.00 (a) What are the estimated standard deviation of x and x ? If specifications are 605 + 10, what is your estimate of the fraction of nonconforming material produced by this process when it is in control at the given level? (b) Suppose you wish to establish a modified x chart to substitute for the original x chart. The process mean is to be controlled so that the fraction nonconforming is less than 0.005. The probability of type I error is to be 0.01. Calculate the control limits. () If the process mean moved to 613.00 (unit), find the ARL, of the x chart in (b). 4. In the fraction nonconforming control chart (p chart). the sample size " should be big enough to have approximately a $0% chance of detecting a process shift of some specified amount 8 (8> 0), (p. L, 8 are given; " is a variable). (20 pts) 1) Show the condition for " is percentage " = (4)'P(1 -P) todetect (hint: refer to the figure on the right for the concept) uEL -- (p+5). 15 2) The condition of n for non-negative LCL of the chart is P process P' shifted with (hint: show the control limits for the Z-sigma p chart first) LCL p-chart
Step by Step Solution
There are 3 Steps involved in it

Get step-by-step solutions from verified subject matter experts