

Question: Problem 3 Estimate the mean and standard deviation of completion times for the project network below. Nodes represent milestones, and arcs represent activities with the
Problem
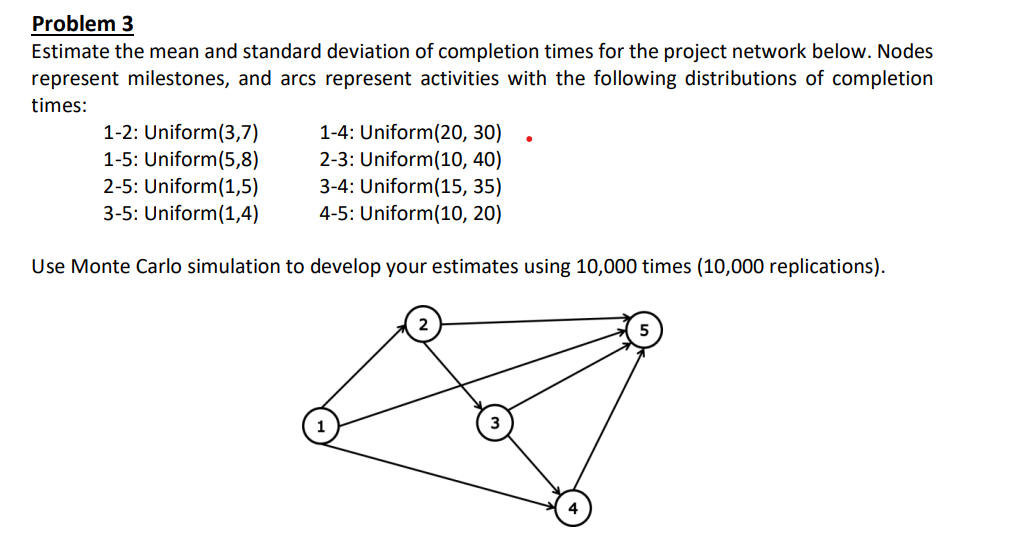
Estimate the mean and standard deviation of completion times for the project network below. Nodes
represent milestones, and arcs represent activities with the following distributions of completion
times:
Use Monte Carlo simulation to develop your estimates using times replications
HOW TO DO THIS IN EXCEL STEP BY STEP
Do it in excel, please
Step by Step Solution
There are 3 Steps involved in it
1 Expert Approved Answer
Step: 1 Unlock

Question Has Been Solved by an Expert!
Get step-by-step solutions from verified subject matter experts
Step: 2 Unlock
Step: 3 Unlock