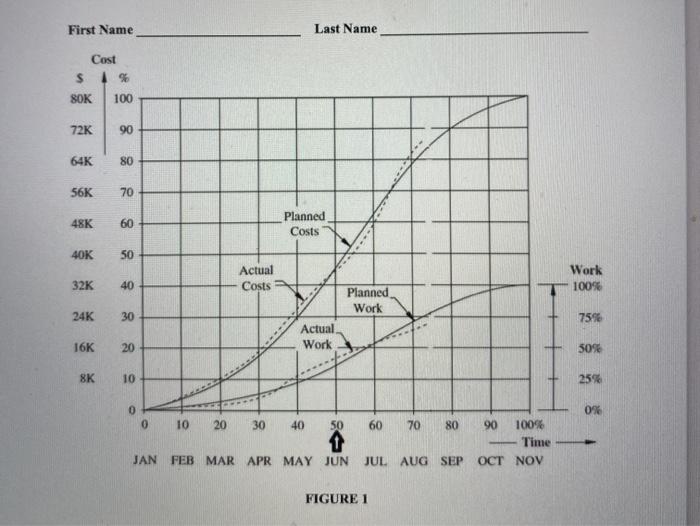
Question: PROBLEM 3 Figure 1 shows an integrated cost/schedule/work graph. At report date of June 1st (see the arrow in Figure 1), which one of the

PROBLEM 3 Figure 1 shows an integrated
PROBLEM 3 Figure 1 shows an integrated cost/schedule/work graph. At report date of June 1st (see the arrow in Figure 1), which one of the following choices indicates the status of the project? a) The project is over budget and behind schedule b) The project is over budget and ahead of schedule c) The project is under budget and behind schedule d) The project is under budget and ahead of schedule e) The project is on budget and ahead of schedule f) The project is under budget and on schedule g) None of the above First Name Last Name Cost % s SOK 100 72K 90 64K 80 56K 70 48K 60 Planned Costs 40K 50 Actual Costs Work 100% 32K 40 Planned Work 24K 30 75% Actual Work 16K 20 50% 8K 10 25% 0% 0 0 10 20 30 40 50 60 70 80 90 100% Time OCT NOV JAN FEB MAR APR MAY JUN JUL AUG SEP FIGURE 1

Step by Step Solution

There are 3 Steps involved in it

1 Expert Approved Answer
Step: 1 Unlock blur-text-image
Question Has Been Solved by an Expert!

Get step-by-step solutions from verified subject matter experts

Step: 2 Unlock
Step: 3 Unlock

Students Have Also Explored These Related General Management Questions!