

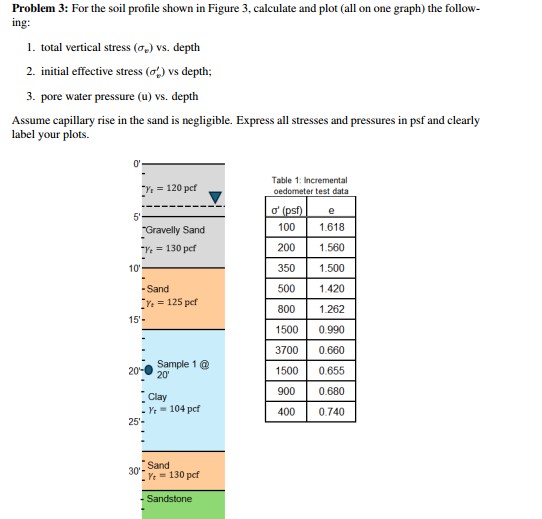
Question: Problem 3 : For the soil profile shown in Figure 3 , calculate and plot ( all on one graph ) the follow - ing:
Problem : For the soil profile shown in Figure calculate and plot all on one graph the follow
ing:
total vertical stress vs depth
initial effective stress : vs depth;
pore water pressure u vs depth
Assume capillary rise in the sand is negligible. Express all stresses and pressures in psf and clearly
label your plots.
Table : Incremental
oedometer test data
Step by Step Solution
There are 3 Steps involved in it
1 Expert Approved Answer
Step: 1 Unlock

Question Has Been Solved by an Expert!
Get step-by-step solutions from verified subject matter experts
Step: 2 Unlock
Step: 3 Unlock