Question: Problem 3 - Forecasting with Regression (12 marks) Demand for ear buds for joggers and those with an active lifestyle has caused sales at Jeremy's
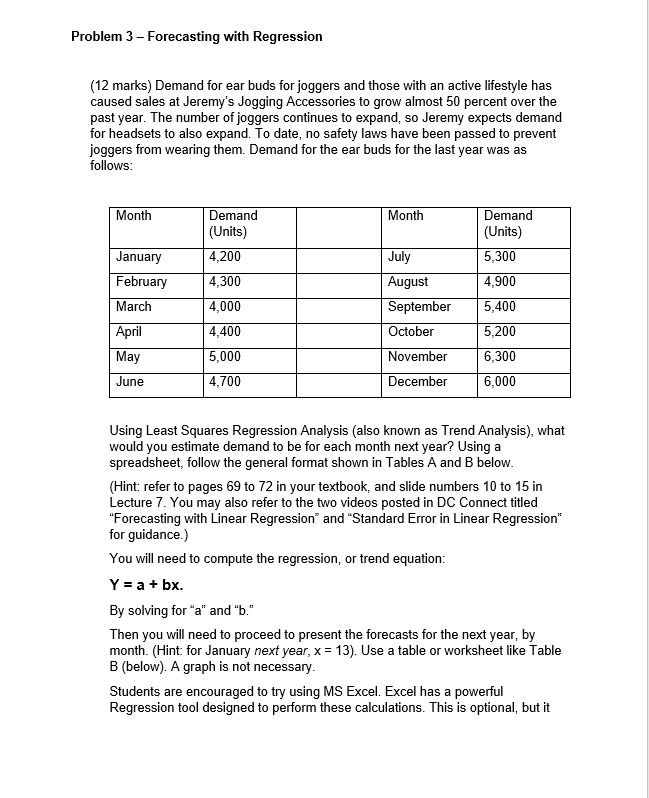
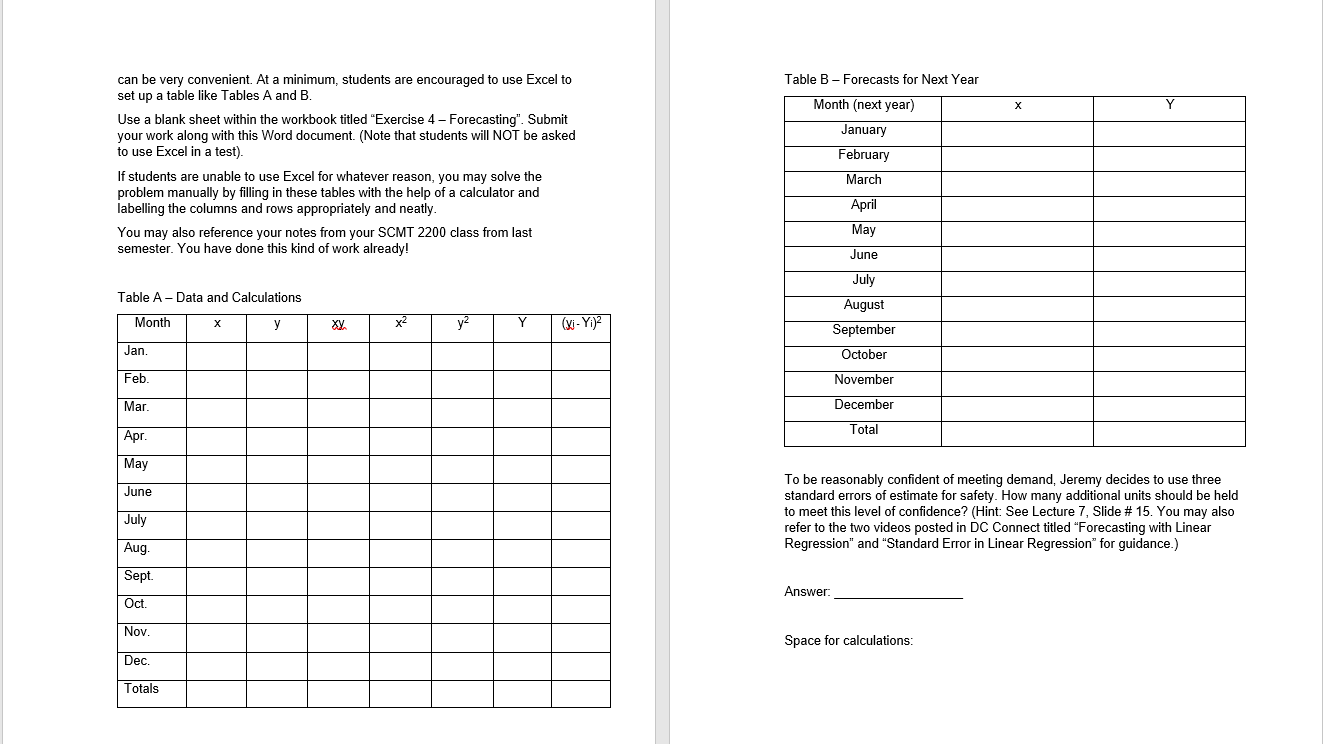
Problem 3 - Forecasting with Regression (12 marks) Demand for ear buds for joggers and those with an active lifestyle has caused sales at Jeremy's Jogging Accessories to grow almost 50 percent over the past year. The number of joggers continues to expand, so Jeremy expects demand for headsets to also expand. To date, no safety laws have been passed to prevent joggers from wearing them. Demand for the ear buds for the last year was as follows: Month Month Demand (Units) 5,300 January February March April May June Demand (Units) 4,200 4,300 4,000 4,400 5,000 4,700 July August September October November December 4,900 5,400 5,200 6,300 6,000 Using Least Squares Regression Analysis (also known as Trend Analysis), what would you estimate demand to be for each month next year? Using a spreadsheet, follow the general format shown in Tables A and B below. (Hint: refer to pages 69 to 72 in your textbook, and slide numbers 10 to 15 in Lecture 7. You may also refer to the two videos posted in DC Connect titled "Forecasting with Linear Regression and "Standard Error in Linear Regression" for guidance.) You will need to compute the regression, or trend equation: Y = a + bx. By solving for "a" and "b." Then you will need to proceed to present the forecasts for the next year, by month. (Hint: for January next year, x = 13). Use a table or worksheet like Table B (below). A graph is not necessary. Students are encouraged to try using MS Excel. Excel has a powerful Regression tool designed to perform these calculations. This is optional, but it x can be very convenient. At a minimum, students are encouraged to use Excel to set up a table like Tables A and B. Use a blank sheet within the workbook titled "Exercise 4 - Forecasting". Submit your work along with this Word document. (Note that students will NOT be asked to use Excel in a test). If students are unable to use Excel for whatever reason, you may solve the problem manually by filling in these tables with the help of a calculator and labelling the columns and rows appropriately and neatly. You may also reference your notes from your SCMT 2200 class from last semester. You have done this kind of work already! Table B - Forecasts for Next Year Month (next year) January February March April May June Table A-Data and Calculations Month y . x2 July August September October y2 Y (xi - Yi) Jan Feb. November Mar. December Total Apr. May June July To be reasonably confident of meeting demand, Jeremy decides to use three standard errors of estimate for safety. How many additional units should be held to meet this level of confidence? (Hint: See Lecture 7, Slide # 15. You may also refer to the two videos posted in DC Connect titled "Forecasting with Linear Regression" and "Standard Error in Linear Regression for guidance.) Aug. Sept. Answer: Oct. Nov. Space for calculations: Dec. Totals


