

Question: Problem 3!!! I posted problem #1 so that you understand the reference being made 3. Write and call a function in Matlab to implement cubic
Problem 3!!! I posted problem #1 so that you understand the reference being made
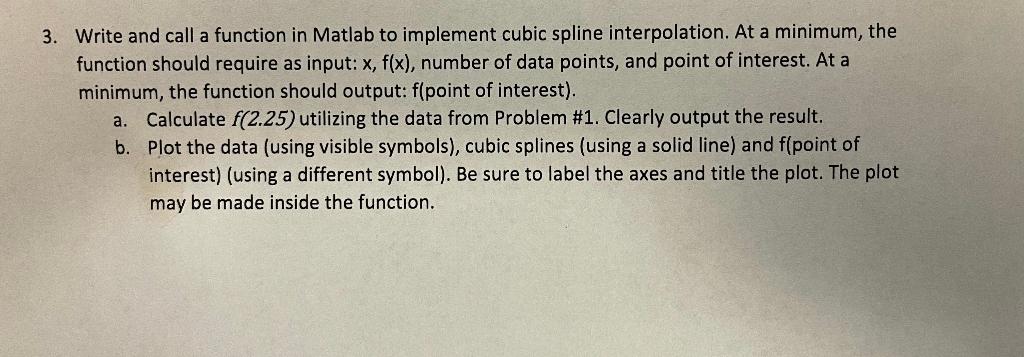
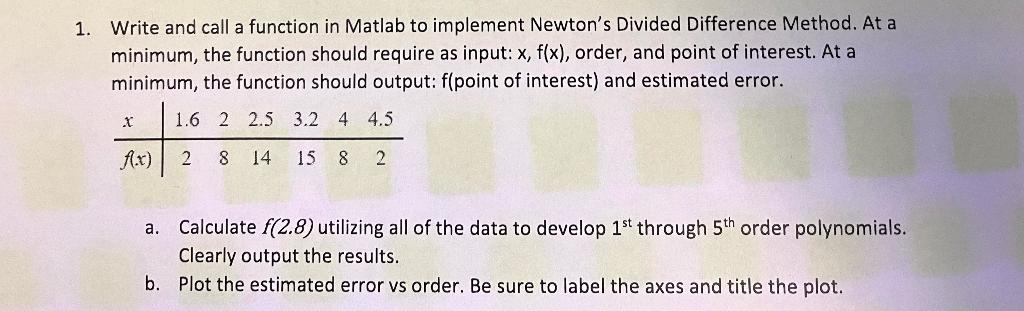
3. Write and call a function in Matlab to implement cubic spline interpolation. At a minimum, the function should require as input: x, f(x), number of data points, and point of interest. At a minimum, the function should output: f(point of interest). a. Calculate f(2.25) utilizing the data from Problem #1. Clearly output the result. b. Plot the data (using visible symbols), cubic splines (using a solid line) and f(point of interest) (using a different symbol). Be sure to label the axes and title the plot. The plot may be made inside the function. 1. Write and call a function in Matlab to implement Newton's Divided Difference Method. At a minimum, the function should require as input: x, f(x), order, and point of interest. At a minimum, the function should output: f(point of interest) and estimated error. 1.6 2 2.5 3.2 4 4.5 fr) 2 8 14 15 8 2 a. Calculate f(2.8) utilizing all of the data to develop 1st through 5th order polynomials. Clearly output the results. b. Plot the estimated error vs order. Be sure to label the axes and title the plot. 3. Write and call a function in Matlab to implement cubic spline interpolation. At a minimum, the function should require as input: x, f(x), number of data points, and point of interest. At a minimum, the function should output: f(point of interest). a. Calculate f(2.25) utilizing the data from Problem #1. Clearly output the result. b. Plot the data (using visible symbols), cubic splines (using a solid line) and f(point of interest) (using a different symbol). Be sure to label the axes and title the plot. The plot may be made inside the function. 1. Write and call a function in Matlab to implement Newton's Divided Difference Method. At a minimum, the function should require as input: x, f(x), order, and point of interest. At a minimum, the function should output: f(point of interest) and estimated error. 1.6 2 2.5 3.2 4 4.5 fr) 2 8 14 15 8 2 a. Calculate f(2.8) utilizing all of the data to develop 1st through 5th order polynomials. Clearly output the results. b. Plot the estimated error vs order. Be sure to label the axes and title the plot
Step by Step Solution
There are 3 Steps involved in it

Get step-by-step solutions from verified subject matter experts