

Question: Problem 3 O solutions submitted (max. 4) . Modify the model derived in class to assess the following situation. Suppose an epidemic (which shall remain

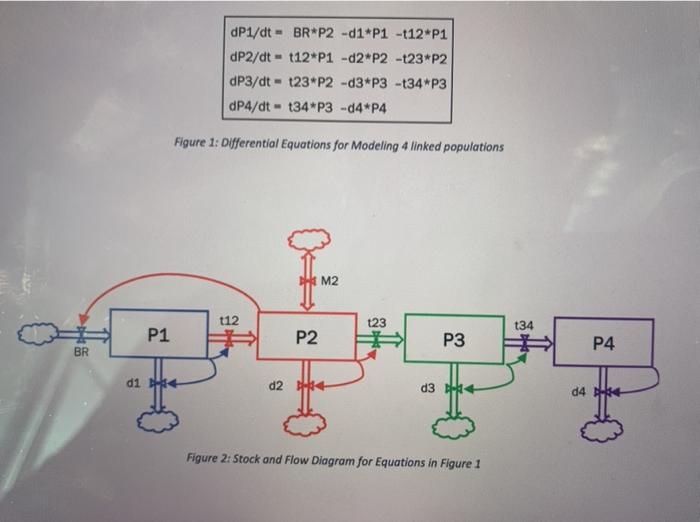
Problem 3 O solutions submitted (max. 4) . Modify the model derived in class to assess the following situation. Suppose an epidemic (which shall remain nameless) raises all group death rates for given period of time It works much like the pulse function from last week & problem 2). This epidemic also lowers b2 birth rate. Assume migration is constant for group P2 SETUP: . paramotor - [b2, 102,03,04,112,123,134) where b2, birth rate in group 2 di, death rates in group PL il transition from group Pito group Pidue to ageing Epletfect fb2Epifactor,drateEpifactor 18tarptEndpl, where b2Epifactor b2Epi- b"b2Epifactor drateEpifactor di Epid1drateEpifactor, ote Mann, constant migration rate for P2 inconds [Piit Pinit, Pini Pini4 .timedata tinitinaldelt . RESULTS P1 P2 P3,P4, group time histories e Rosu DE MATLAmination Function 1 function (P1,P2, P3, P4)- Demographics_3_fcn(parameters, Epieffect, Mann, initconds, tinedata) 4 end dP1/dt - BR*P2 -d1*P1 -12*P1 dP2/dt = t12*P1 -d2 P2 -t23*P2 dP3/dt - t23*P2 -d3*P3 -134*P3 dP4/dt t34*P3 -d4*P4 Figure 1: Differential Equations for Modeling 4 linked populations M2 t12 123 134 P1 P2 P3 P4 BR d1 d2 d3 H d4 Rust Figure 2: Stock and Flow Diagram for Equations in Figure 1 Problem 3 O solutions submitted (max. 4) . Modify the model derived in class to assess the following situation. Suppose an epidemic (which shall remain nameless) raises all group death rates for given period of time It works much like the pulse function from last week & problem 2). This epidemic also lowers b2 birth rate. Assume migration is constant for group P2 SETUP: . paramotor - [b2, 102,03,04,112,123,134) where b2, birth rate in group 2 di, death rates in group PL il transition from group Pito group Pidue to ageing Epletfect fb2Epifactor,drateEpifactor 18tarptEndpl, where b2Epifactor b2Epi- b"b2Epifactor drateEpifactor di Epid1drateEpifactor, ote Mann, constant migration rate for P2 inconds [Piit Pinit, Pini Pini4 .timedata tinitinaldelt . RESULTS P1 P2 P3,P4, group time histories e Rosu DE MATLAmination Function 1 function (P1,P2, P3, P4)- Demographics_3_fcn(parameters, Epieffect, Mann, initconds, tinedata) 4 end dP1/dt - BR*P2 -d1*P1 -12*P1 dP2/dt = t12*P1 -d2 P2 -t23*P2 dP3/dt - t23*P2 -d3*P3 -134*P3 dP4/dt t34*P3 -d4*P4 Figure 1: Differential Equations for Modeling 4 linked populations M2 t12 123 134 P1 P2 P3 P4 BR d1 d2 d3 H d4 Rust Figure 2: Stock and Flow Diagram for Equations in Figure 1
Step by Step Solution
There are 3 Steps involved in it

Get step-by-step solutions from verified subject matter experts