

Question: 2) What are the x-bar chart upper and lower control limits? 3) What is the estimate of the process mean for whenever it is under
 2) What are the x-bar chart upper and lower control limits?
3) What is the estimate of the process mean for whenever it is under control?
Please show all necessary work. Thankyou!
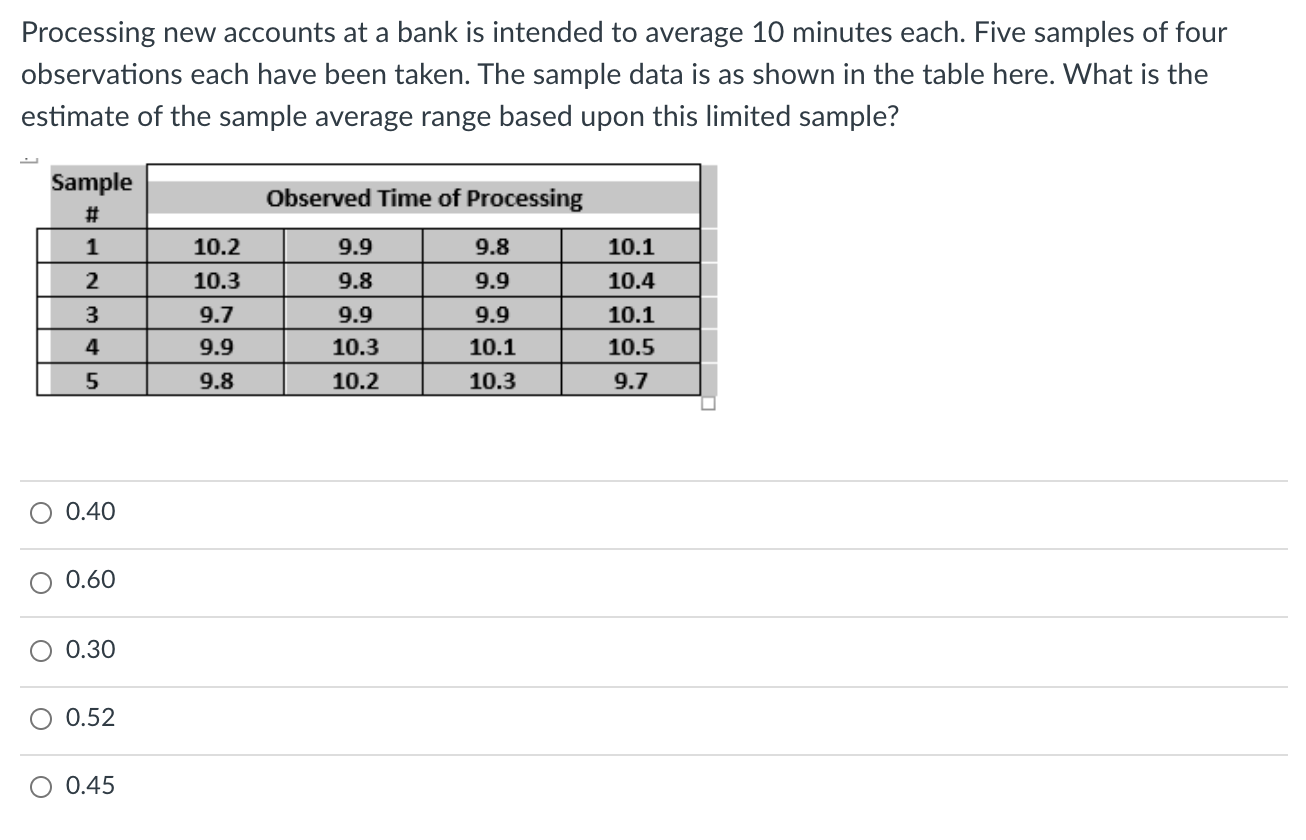
Processing new accounts at a bank is intended to average 10 minutes each. Five samples of four observations each have been taken. The sample data is as shown in the table here. What is the estimate of the sample average range based upon this limited sample? Sample # Observed Time of Processing 1 10.2 9.9 9.8 2 3 10.3 9.7 9.9 9.8 9.9 10.3 10.2 9.9 9.9 10.1 10.3 10.1 10.4 10.1 10.5 9.7 4 5 9.8 0.40 0.60 0.30 0.52 O 0.45Step by Step Solution
There are 3 Steps involved in it
1 Expert Approved Answer
Step: 1 Unlock

Question Has Been Solved by an Expert!
Get step-by-step solutions from verified subject matter experts
Step: 2 Unlock
Step: 3 Unlock