

Question: Problem 3.3: Development Accounting. (30 points) In this exercise, we will first re-do the example from lecture with new (made-up!) numbers. We will then add

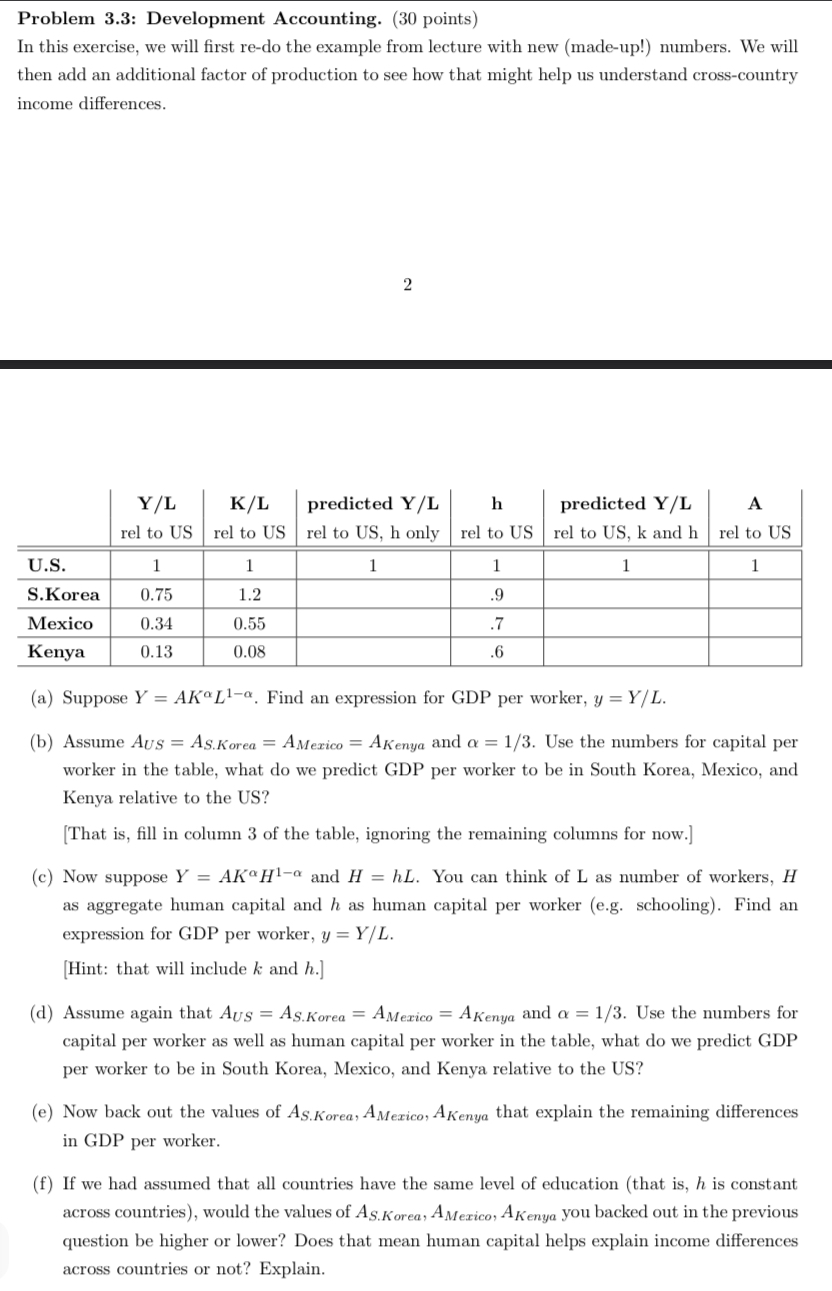
Problem 3.3: Development Accounting. (30 points) In this exercise, we will first re-do the example from lecture with new (made-up!) numbers. We will then add an additional factor of production to see how that might help us understand cross-country income differences. N Y/ L K/L predicted Y/L h predicted Y/L A rel to US rel to US rel to US, h only rel to US rel to US, k and h rel to US U.S. 1 1 1 S.Korea 0.75 1.2 .9 Mexico 0.34 0.55 .7 Kenya 0.13 0.08 .6 (a) Suppose Y = AKOL1-. Find an expression for GDP per worker, y = Y/L. (b) Assume AUs = AS.Korea = AMerico = AKenya and o = 1/3. Use the numbers for capital per worker in the table, what do we predict GDP per worker to be in South Korea, Mexico, and Kenya relative to the US? [That is, fill in column 3 of the table, ignoring the remaining columns for now.] (c) Now suppose Y = AK"HI-@ and H = hL. You can think of L as number of workers, H as aggregate human capital and h as human capital per worker (e.g. schooling). Find an expression for GDP per worker, y = Y/L. [Hint: that will include k and h.] (d) Assume again that Aus = AS.Korea = AMexico = AKenya and o = 1/3. Use the numbers for capital per worker as well as human capital per worker in the table, what do we predict GDP per worker to be in South Korea, Mexico, and Kenya relative to the US? (e) Now back out the values of AS. Korea, AMexico, AKenya that explain the remaining differences in GDP per worker. (f) If we had assumed that all countries have the same level of education (that is, h is constant across countries), would the values of AS.Korea, AMexico, AKenya you backed out in the previous question be higher or lower? Does that mean human capital helps explain income differences across countries or not? Explain
Step by Step Solution
There are 3 Steps involved in it

Get step-by-step solutions from verified subject matter experts