

Question: Problem 3-31 Balance Sheet (LO1) The table below contains data on Fincorp Inc. The balance sheet items correspond to values at year-end 2018 and 2019,
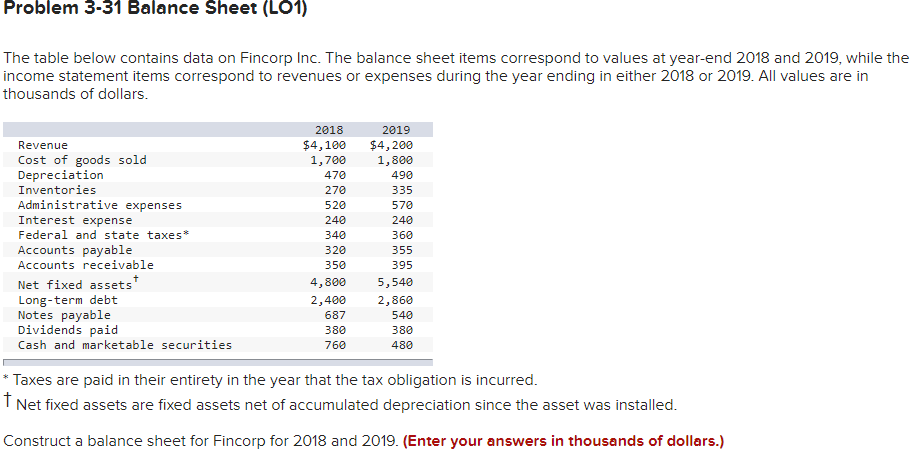
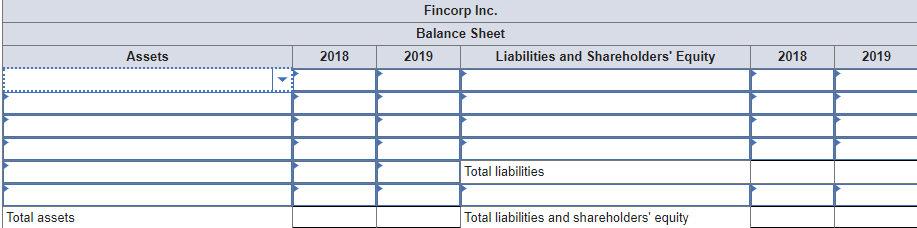
Problem 3-31 Balance Sheet (LO1) The table below contains data on Fincorp Inc. The balance sheet items correspond to values at year-end 2018 and 2019, while the income statement items correspond to revenues or expenses during the year ending in either 2018 or 2019. All values are in thousands of dollars. Revenue Cost of goods sold Depreciation Inventories Administrative expenses Interest expense Federal and state taxes Accounts payable Accounts receivable Net fixed assets Long-term debt Notes payable Dividends paid Cash and marketable securities 2018 $4,100 1,700 470 270 520 240 340 320 350 4,800 2,400 687 380 760 2019 $4,200 1,800 490 335 570 240 360 355 395 5,540 2,860 540 380 480 * Taxes are paid in their entirety in the year that the tax obligation is incurred. Net fixed assets are fixed assets net of accumulated depreciation since the asset was installed. Construct a balance sheet for Fincorp for 2018 and 2019. (Enter your answers in thousands of dollars.) Fincorp Inc. Balance Sheet 2019 Liabilities and Shareholders' Equity Assets 2018 2018 2019 Total liabilities Total assets Total liabilities and shareholders' equity
Step by Step Solution
There are 3 Steps involved in it

Get step-by-step solutions from verified subject matter experts