

Question: Problem 3.35 Scatterplot, High-Low Method, Regression The management of Wheeler Company has decided to develop cost formulas for its major over- head activities. Wheeler uses
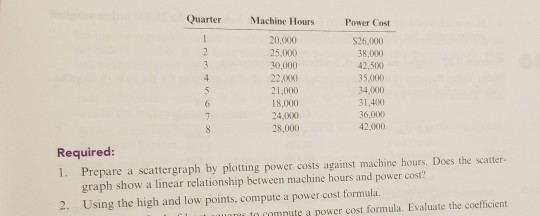
Problem 3.35 Scatterplot, High-Low Method, Regression The management of Wheeler Company has decided to develop cost formulas for its major over- head activities. Wheeler uses a highly automated manufacturing process, and power costs are a significant manufacturing cost. Cost analysts have decided that power costs are mixed; thus, they must be broken into their fixed and variable elements so that the cost behavior of the power usage activity can be properly described. Machine hours have been selected as the activity driver for power costs. The following data for the past eight quarters have been collected: Quarter Machine Hours Power Cost 20.000 $26.000 25.000 1 30,000 42.500 22.00 35.000 21.000 4. 18.000 31,400 24.XXO 36.00 28.000 42.000 Required: 1. Prepare a scattergraph by plotting power costs against machine hours. Does the scatter- graph show a linear relationship between machine hours and power cost? 2. Using the high and low points, compute a power cost formula minute a now cost formula. Evaluate the coefficient
Step by Step Solution
There are 3 Steps involved in it

Get step-by-step solutions from verified subject matter experts