

Question: Scatterplot, High-Low Method, Regression The management of Wheeler Company has decided to develop cost formulas for its major overhead activities. Wheeler uses a highly automated
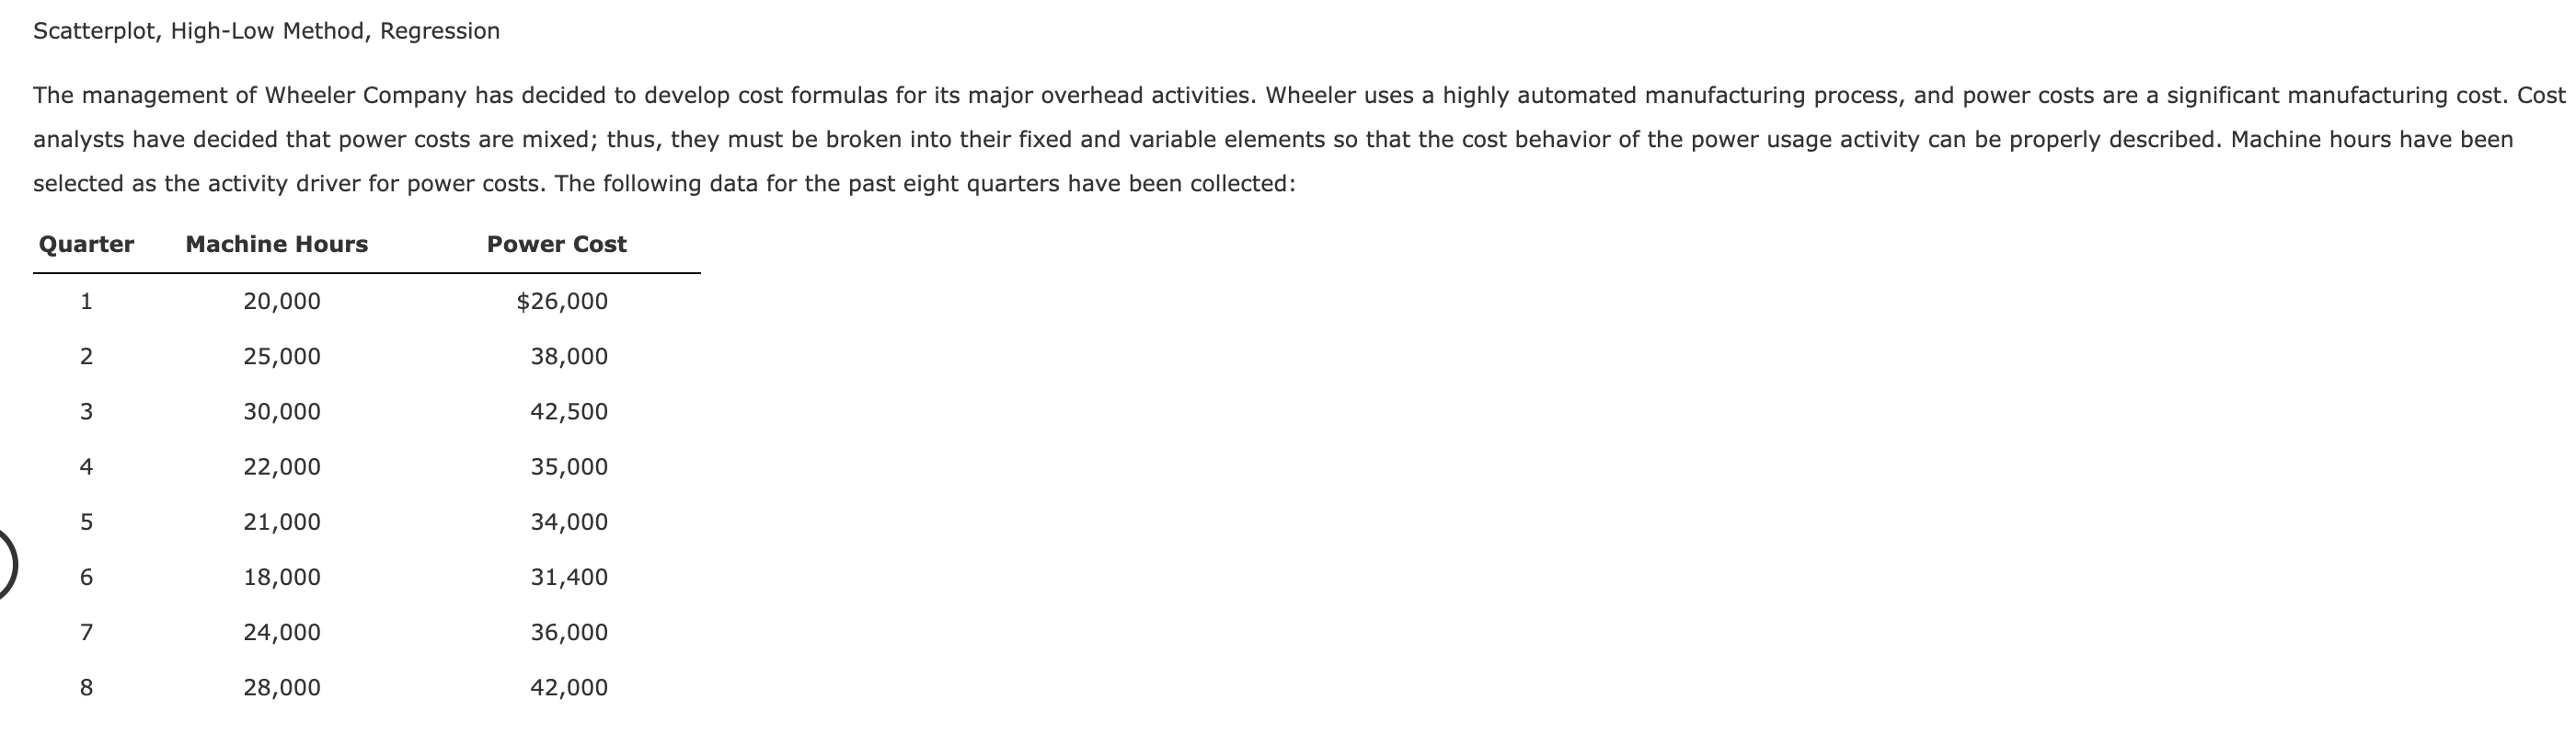
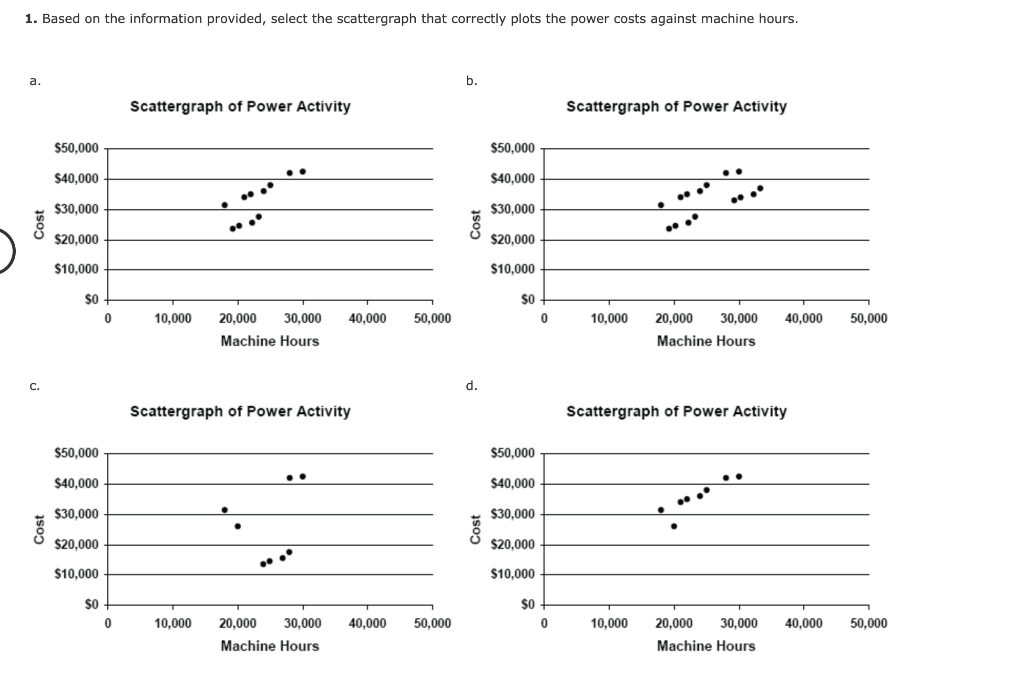
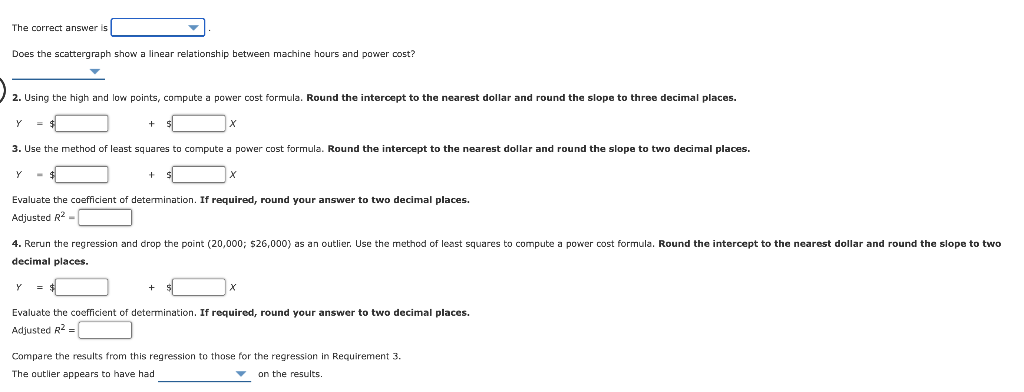
Scatterplot, High-Low Method, Regression The management of Wheeler Company has decided to develop cost formulas for its major overhead activities. Wheeler uses a highly automated manufacturing process, and power costs are a significant manufacturing cost. Cost analysts have decided that power costs are mixed; thus, they must be broken into their fixed and variable elements so that the cost behavior of the power usage activity can be properly described. Machine hours have been selected as the activity driver for power costs. The following data for the past eight quarters have been collected: Quarter Machine Hours Power Cost 1 20,000 $26,000 2 25,000 38,000 3 30,000 42,500 4 22,000 35,000 5 21,000 34,000 6 18,000 31,400 7 24,000 36,000 8 28,000 42,000 1. Based on the information provided, select the scattergraph that correctly plots the power costs against machine hours. a. b. Scattergraph of Power Activity Scattergraph of Power Activity $50,000 $50,000 $40.000 $ $40,000 $30,000 $30,000 Cost $20,000 $20.000 $10,000 $10.000 SO SO 0 10,000 40.000 50,000 0 10,000 40,000 50,000 20,000 30.000 Machine Hours 20,000 30,000 Machine Hours c. d. Scattergraph of Power Activity Scattergraph of Power Activity $50,000 $50,000 $40,000 $40,000 $30,000 $30,000 Cost Cost $20,000 $20,000 $10,000 $10,000 $0 0 SO 0 10,000 40,000 50,000 10.000 40,000 50,000 20,000 30,000 Machine Hours 20,000 30.000 Machine Hours The correct answer is Does the scattergraph show a linear relationship between machine hours and power cost? 2. Using the high and low points, compute a power cost formula. Round the intercept to the nearest dollar and round the slope to three decimal places. Y + 3. Use the method of least squares compute a power cost formula. Round the intercept to the nearest dollar and round the slope to two decimal places. Y Evaluate the coefficient of determination. If required, round your answer to two decimal places. Adjusted R2- compute a power cost formula. Round the intercept to the nearest dollar and round the slope to two 4. Rerun the regression and drop the point (20,000; $26,000) as an outlier. Use the method of least squares decimal places. Y Evaluate the coefficient of determination. If required, round your answer to two decimal places. Adjusted R2 Compare the results from this regression to those for the regression in Requirement 3. The outller appears to have had on the results
Step by Step Solution
There are 3 Steps involved in it

Get step-by-step solutions from verified subject matter experts