

Question: PROBLEM 3-5: Breakeven Sensitivity Analysis Investment (enter with - sign) Plant life Salvage value Variable Cost % Fixed operating cost Tax rate Working capital Given
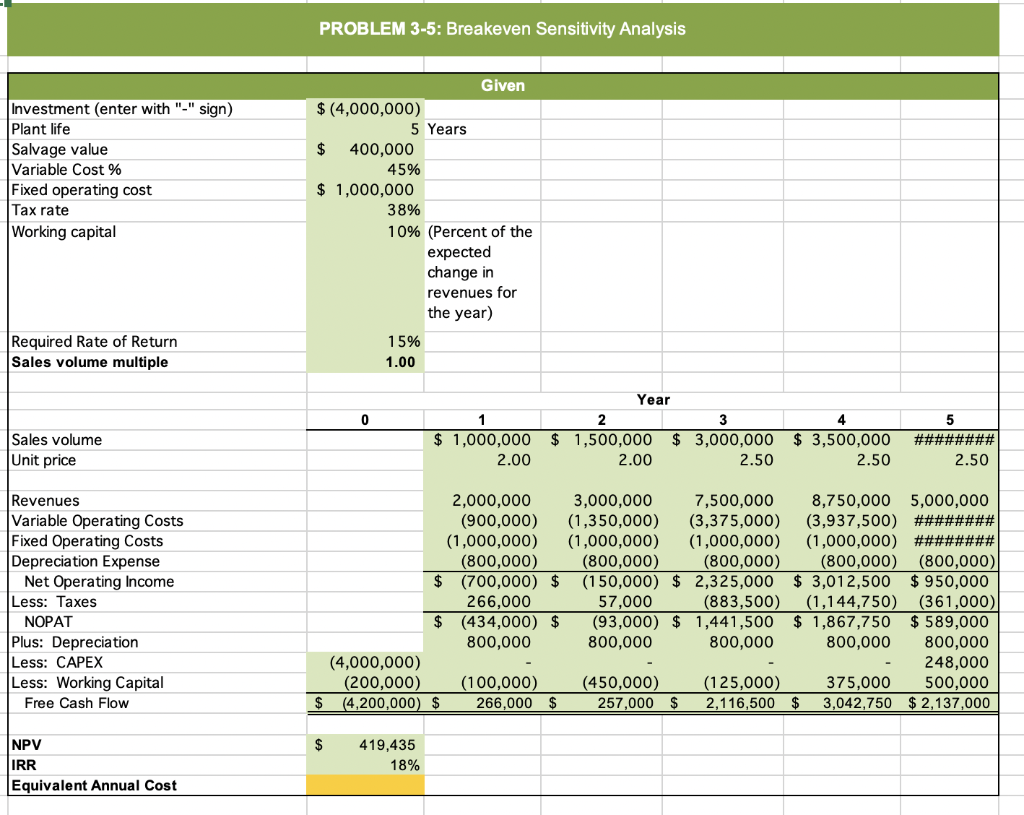
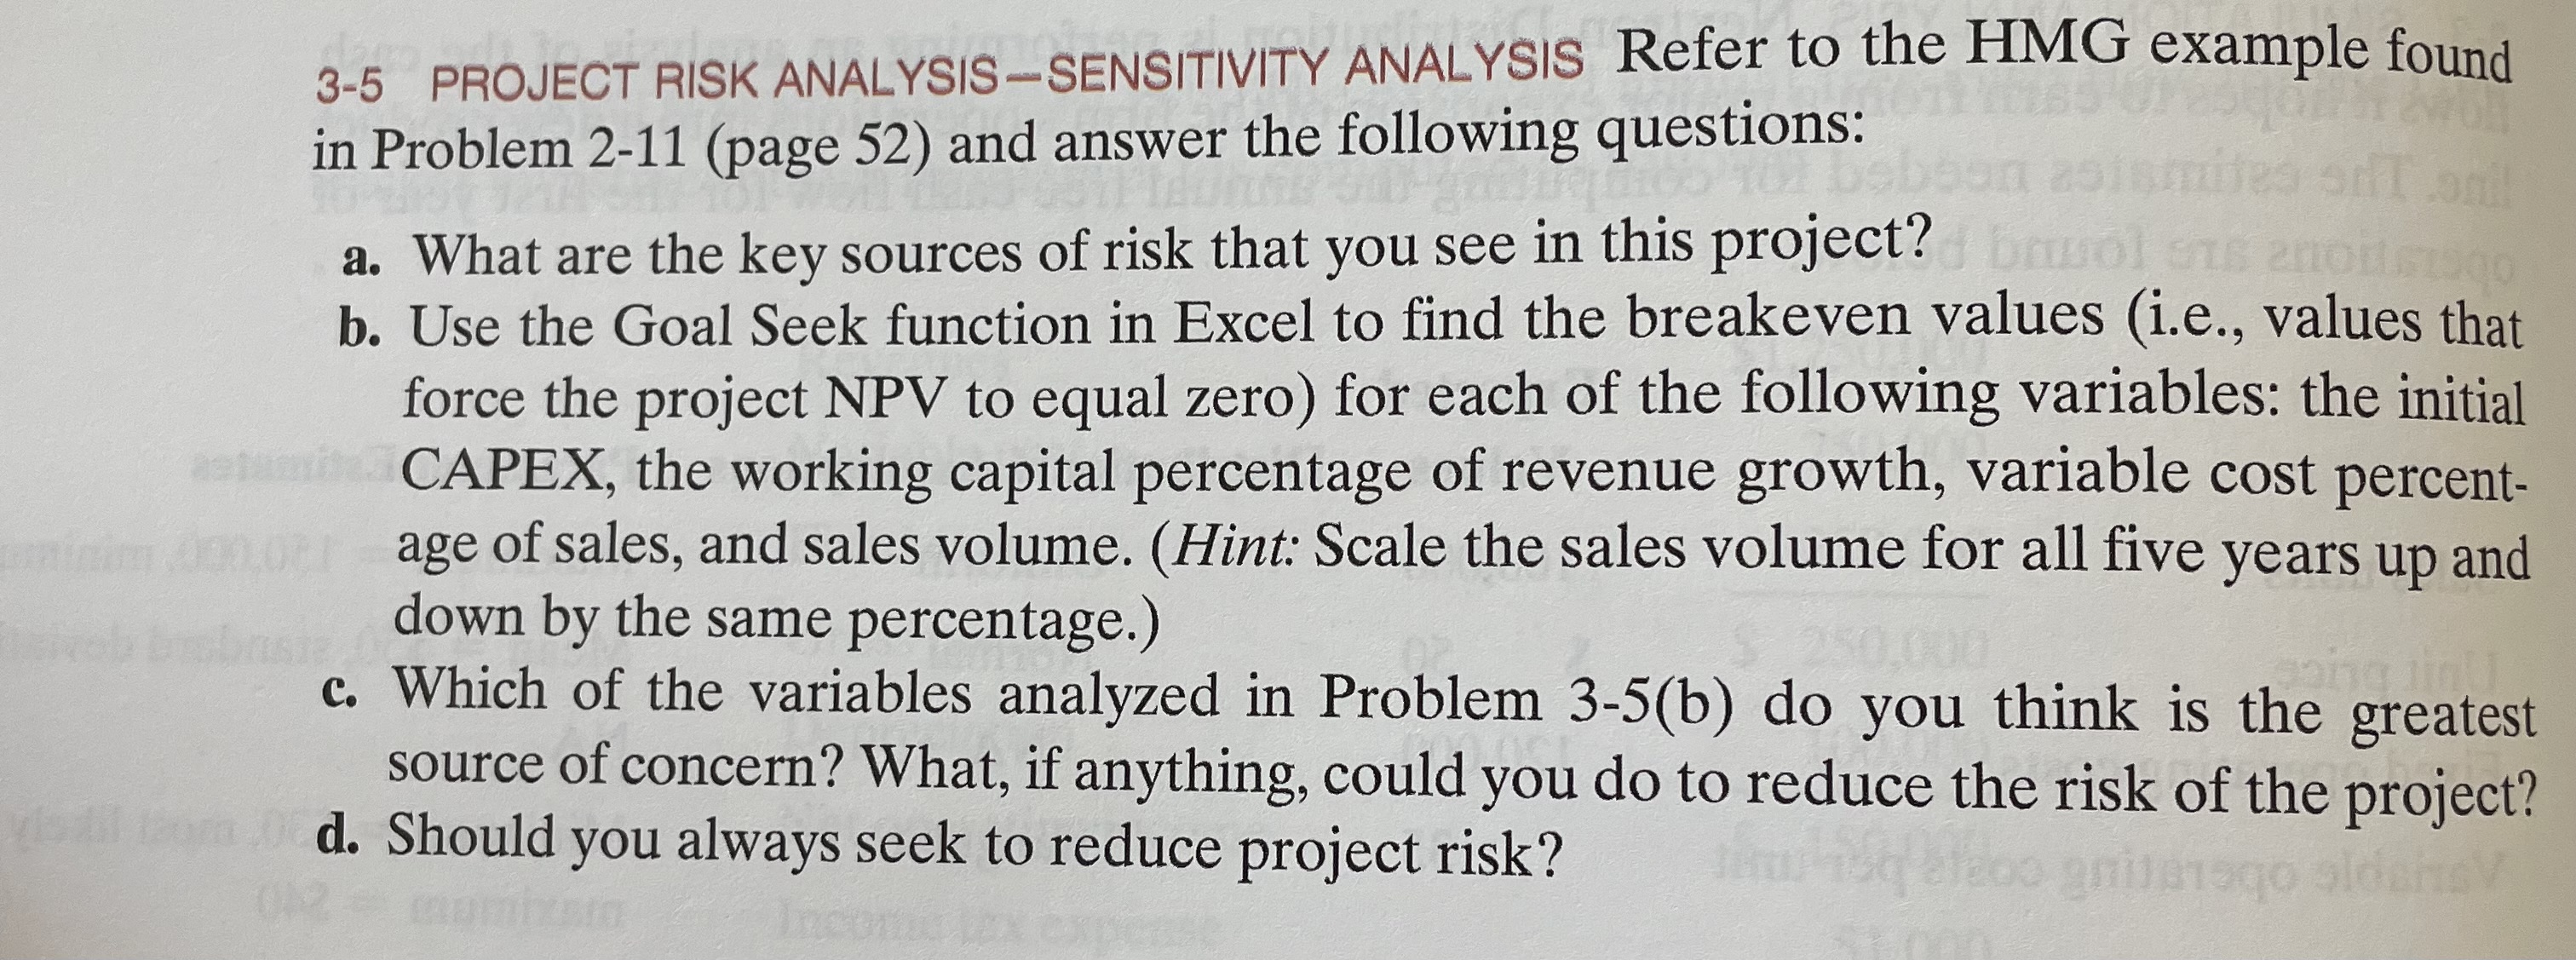
PROBLEM 3-5: Breakeven Sensitivity Analysis Investment (enter with "-" sign) Plant life Salvage value Variable Cost % Fixed operating cost Tax rate Working capital Given $ (4,000,000) 5 Years $ 400,000 45% $ 1,000,000 38% 10% (Percent of the expected change in revenues for the year) 1 5% 1.00 Required Rate of Return Sales volume multiple Year 0 Sales volume Unit price 1 $ 1,000,000 2.00 2 3 4 $ 1,500,000 $ 3,000,000 $ 3,500,000 2.00 2.50 2.50 5 ######## 2.50 Revenues Variable Operating Costs Fixed Operating costs Depreciation Expense Net Operating Income Less: Taxes NOPAT Plus: Depreciation Less: CAPEX Less: Working Capital Free Cash Flow 2,000,000 (900,000) (1,000,000) (800,000) $ (700,000) $ 266,000 $ (434,000) $ 800,000 (4,000,000) (200,000) (100,000) $ (4,200,000 $ 266,000 $ 3,000,000 7,500,000 8,750,000 5,000,000 (1,350,000) (3,375,000) (3,937,500) ######## (1,000,000) (1,000,000) (1,000,000) ######## (800,000) (800,000) (800,000) (800,000) (150,000) $ 2,325,000 $3,012,500 $ 950,000 57,000 (883,500) (1,144,750) (361,000) (93,000) $ 1,441,500 $ 1,867,750 $ 589,000 800,000 800,000 800,000 800,000 248,000 (450,000) (125,000) 375,000 500,000 257,000 $ 2,116,500 3,042,750 $ 2,137,000 $ NPV IRR Equivalent Annual Cost 419,435 18% 3-5 PROJECT RISK ANALYSIS-SENSITIVITY ANALYSIS Refer to the HMG example found in Problem 2-11 (page 52) and answer the following questions: a. What are the key sources of risk that you see in this project? brol b. Use the Goal Seek function in Excel to find the breakeven values (i.e., values that force the project NPV to equal zero) for each of the following variables: the initial CAPEX, the working capital percentage of revenue growth, variable cost percent- age of sales, and sales volume. (Hint: Scale the sales volume for all five years up and down by the same percentage.) c. Which of the variables analyzed in Problem 3-5(b) do you think is the greatest source of concern? What, if anything, could you do to reduce the risk of the project? d. Should you always seek to reduce project risk? PROBLEM 3-5: Breakeven Sensitivity Analysis Investment (enter with "-" sign) Plant life Salvage value Variable Cost % Fixed operating cost Tax rate Working capital Given $ (4,000,000) 5 Years $ 400,000 45% $ 1,000,000 38% 10% (Percent of the expected change in revenues for the year) 1 5% 1.00 Required Rate of Return Sales volume multiple Year 0 Sales volume Unit price 1 $ 1,000,000 2.00 2 3 4 $ 1,500,000 $ 3,000,000 $ 3,500,000 2.00 2.50 2.50 5 ######## 2.50 Revenues Variable Operating Costs Fixed Operating costs Depreciation Expense Net Operating Income Less: Taxes NOPAT Plus: Depreciation Less: CAPEX Less: Working Capital Free Cash Flow 2,000,000 (900,000) (1,000,000) (800,000) $ (700,000) $ 266,000 $ (434,000) $ 800,000 (4,000,000) (200,000) (100,000) $ (4,200,000 $ 266,000 $ 3,000,000 7,500,000 8,750,000 5,000,000 (1,350,000) (3,375,000) (3,937,500) ######## (1,000,000) (1,000,000) (1,000,000) ######## (800,000) (800,000) (800,000) (800,000) (150,000) $ 2,325,000 $3,012,500 $ 950,000 57,000 (883,500) (1,144,750) (361,000) (93,000) $ 1,441,500 $ 1,867,750 $ 589,000 800,000 800,000 800,000 800,000 248,000 (450,000) (125,000) 375,000 500,000 257,000 $ 2,116,500 3,042,750 $ 2,137,000 $ NPV IRR Equivalent Annual Cost 419,435 18% 3-5 PROJECT RISK ANALYSIS-SENSITIVITY ANALYSIS Refer to the HMG example found in Problem 2-11 (page 52) and answer the following questions: a. What are the key sources of risk that you see in this project? brol b. Use the Goal Seek function in Excel to find the breakeven values (i.e., values that force the project NPV to equal zero) for each of the following variables: the initial CAPEX, the working capital percentage of revenue growth, variable cost percent- age of sales, and sales volume. (Hint: Scale the sales volume for all five years up and down by the same percentage.) c. Which of the variables analyzed in Problem 3-5(b) do you think is the greatest source of concern? What, if anything, could you do to reduce the risk of the project? d. Should you always seek to reduce project risk
Step by Step Solution
There are 3 Steps involved in it

Get step-by-step solutions from verified subject matter experts