

Question: Problem 4 ( 1 5 Points ) . The complete diagram for the following PERT problem is shown below. table [ [ Activity ,
Problem Points
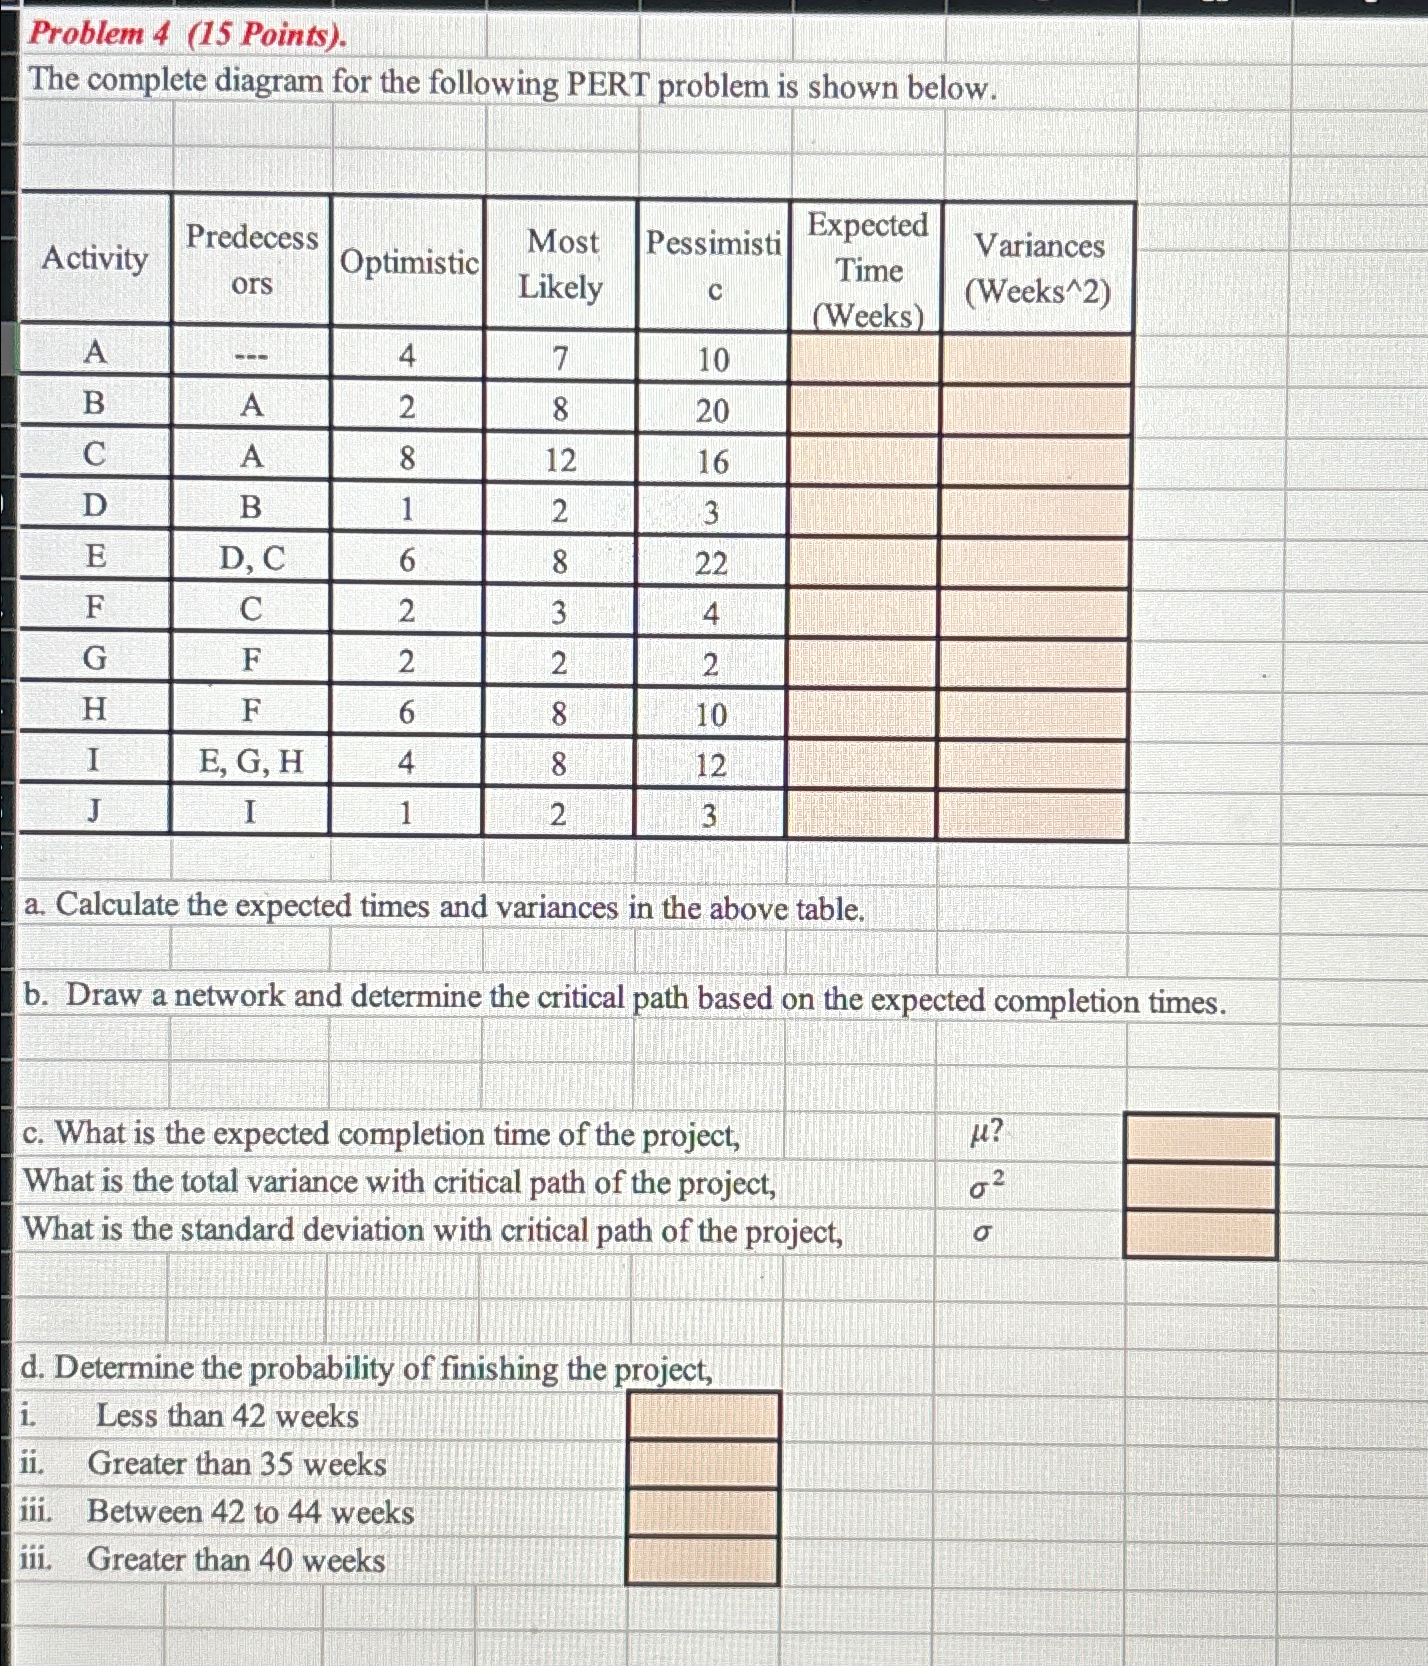
The complete diagram for the following PERT problem is shown below.
tableActivitytablePredecessorsOptimistic,tableMostLikelytablePessimistictableExpectedTimeWeekstableVariances WeeksABACADBED CFCGFHFIE G HJI,
a Calculate the expected times and variances in the above table.
b Draw a network and determine the critical path based on the expected completion times.
c What is the expected completion time of the project,
What is the total variance with critical path of the project,
What is the standard deviation with critical path of the project,
d Determine the probability of finishing the project,
i Less than weeks
ii Greater than weeks
iii. Between to weeks
iii. Greater than weeks
table
Step by Step Solution
There are 3 Steps involved in it
1 Expert Approved Answer
Step: 1 Unlock

Question Has Been Solved by an Expert!
Get step-by-step solutions from verified subject matter experts
Step: 2 Unlock
Step: 3 Unlock