

Question: Problem 4: (Do this with MatLab) Plot the function f(x,y) = 12 +3,2 + xy = 1. Use a contour plot and plot a single
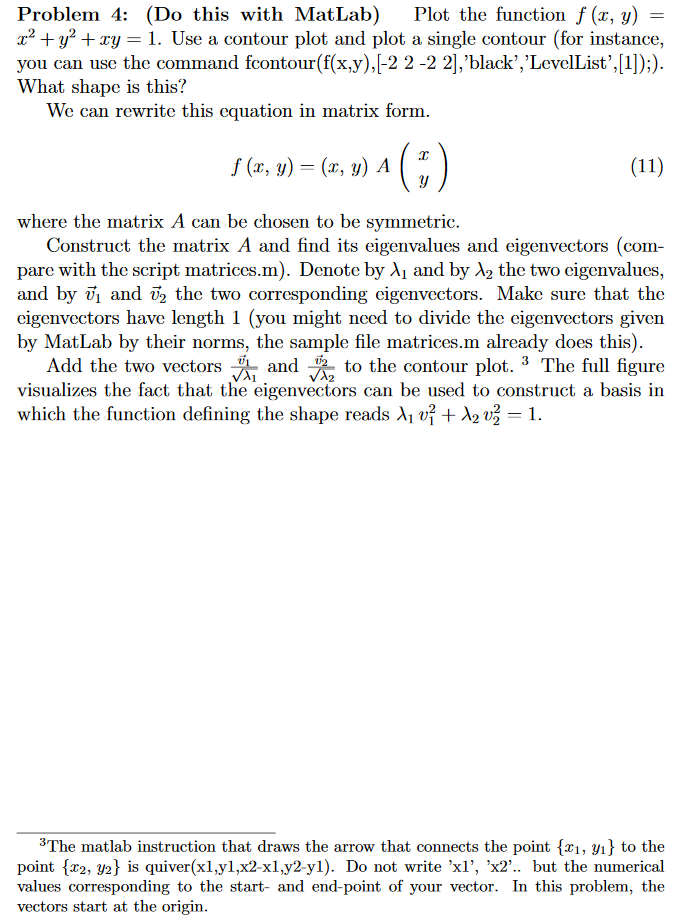
Problem 4: (Do this with MatLab) Plot the function f(x,y) = 12 +3,2 + xy = 1. Use a contour plot and plot a single contour (for instance, you can use the command fcontour(f(x.y),[-2 2 -2 2],'black','LevelList',[1]):) What shape is this? We can rewrite this equation in matrix form. f (x, y)(, )A where the matrix A can be chosen to be symmetric. Construct the matrix A and find its eigenvalues and eigenvectors (com pare with the script matrices. n). Denote by and by 2 the two eigenvalues, and by vi and v2 the two corresponding eigenvectors. Make sure that the cigenvectors have length 1 (you might need to divide the cigenvectors given by MatLab by their norms, the sample file matrices.m already does this) Add the two vectors and to the contour plot. 3 The full figure visualizes the fact that the eigenvectors can be used to construct a basis in which the function defining the shape reads | u + 2v-1. 2 3The matlab instruction that draws the arrow that connects the point(x1, y1} to the point {x22} is quiver(xl.y1.x2-xly2-yi). Do not write 'x1', 'x2.. but the numerical values corresponding to the start- and end-point of your vector. In this problem, the vectors start at the origin
Step by Step Solution
There are 3 Steps involved in it

Get step-by-step solutions from verified subject matter experts