

Question: Problem 4: Net Sales Earnings $ Millions $ Millions 1997 387 100 1997 24 100 1998 420 109 1998 39 162 1999 477 123 1999
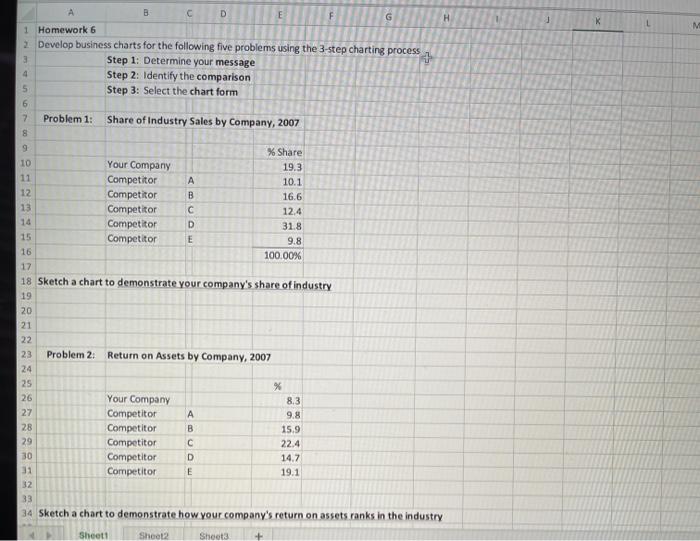
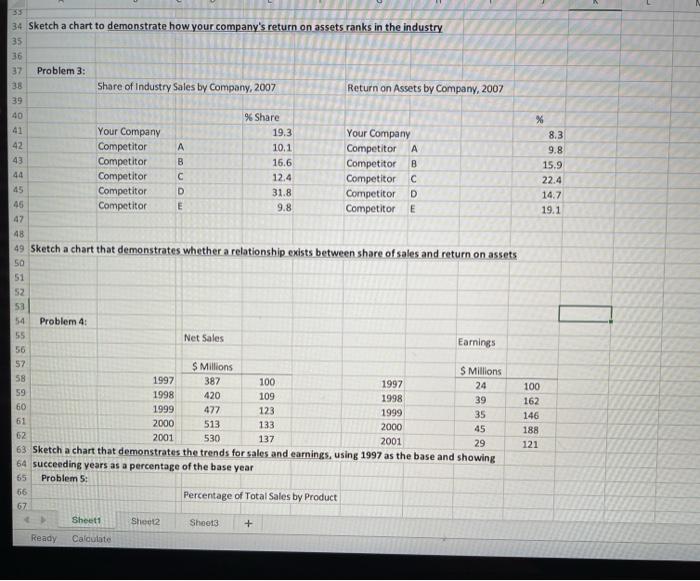
| Problem 4: | ||||||||||
| Net Sales | Earnings | |||||||||
| $ Millions | $ Millions | |||||||||
| 1997 | 387 | 100 | 1997 | 24 | 100 | |||||
| 1998 | 420 | 109 | 1998 | 39 | 162 | |||||
| 1999 | 477 | 123 | 1999 | 35 | 146 | |||||
| 2000 | 513 | 133 | 2000 | 45 | 188 | |||||
| 2001 | 530 | 137 | 2001 | 29 | 121 | |||||
| Sketch a chart that demonstrates the trends for sales and earnings, using 1997 as the base and showing | ||||||||||
| succeeding years as a percentage of the base year | ||||||||||
Step by Step Solution
There are 3 Steps involved in it
1 Expert Approved Answer
Step: 1 Unlock

Question Has Been Solved by an Expert!
Get step-by-step solutions from verified subject matter experts
Step: 2 Unlock
Step: 3 Unlock