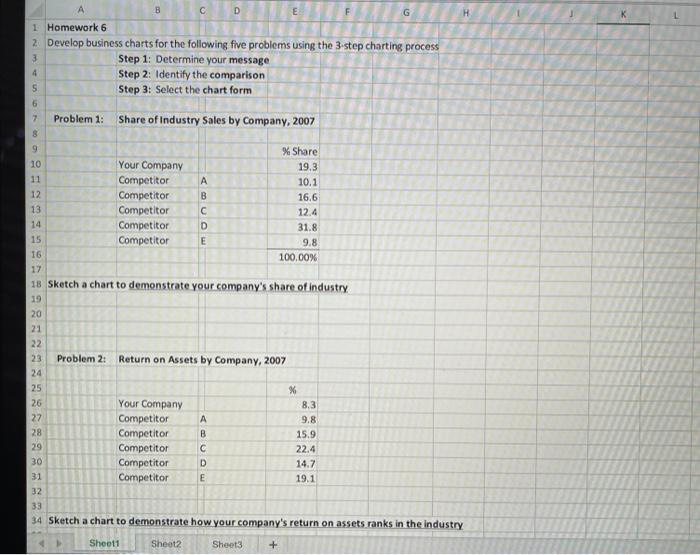
Question: A B co 1 Homework 6 2 Develop business charts for the following five problems using the 3-step charting process Step 1: Determine your message

A B co 1 Homework 6 2 Develop business charts for
A B co 1 Homework 6 2 Develop business charts for the following five problems using the 3-step charting process Step 1: Determine your message 4 Step 2: Identify the comparison 5 Step 3: Select the chart form 3 6 7 Problem 1: Share of Industry Sales by Company, 2007 8 9 % Share 10 Your Company 19.3 11 Competitor A 10.1 12 Competitor B 16.6 13 Competitor 12.4 14 Competitor D 31.8 15 Competitor E 9.8 16 100.00% 17 18 Sketch a chart to demonstrate your company's share of industry 19 20 21 22 23 Problem 2: Return on Assets by Company, 2007 24 25 % 26 Your Company 8.3 27 Competitor 9.8 28 Competitor B 15.9 29 Competitor 22.4 30 Competitor D 14.7 31 Competitor E 19.1 32 33 34 Sketch a chart to demonstrate how your company's return on assets ranks in the industry Sheet1 Sheet2 Sheet3 + M X 8.3 9.8 158 22.4 14.7 19.1 A D F G H 33 34 Sketch a chart to demonstrate how your company's return on assets ranks in the industry 35 36 37 Problem 3: 38 Share of industry Sales by Company, 2007 Return on Assets by Company, 2007 39 40 * Share 41 Your Company 193 Your Company 62 Competitor A 10.1 Competitor A 43 Competitor B 16.6 Competitor B 44 Competitor 12.4 Competitor Competitor D 31.8 Competitor D 46 Competitor E 9.8 Competitor E 47 48 49 Sketch a chart that demonstrates whether a relationship exists between share of sales and return on assets 50 51 52 53 54 Problem 4: 55 Net Sales Earnings 56 57 5 Millions S Millions 58 1997 387 100 1997 24 1998 420 109 1998 39 60 1999 477 123 1999 35 61 2000 513 133 2000 45 2001 530 137 2001 29 63 Sketch a chart that demonstrates the trends for sales and earnings, using 1997 as the base and showing 64 Succeeding years as a percentage of the base year 65 Problem 5: 66 Percentage of Total Sales by Product 2228 100 162 146 188 121 Sheet1 Sheet2 Sheets + Ready Calculate Calibri (Body 12 ' 22 Wrap Text General w paste B TV A H TH Merge Comor $ % ) Conditional Format Formatting as Table K53 x fe A 0 G H 1 M N 100 162 146 188 121 530 137 0 54 Problem 4 55 Net Sales Earnings 56 57 $ Millions 5 Millions 58 1997 387 100 1997 24 59 1998 420 109 1998 39 60 1999 477 123 1999 35 61 2000 513 133 2000 45 2001 2001 29 03 Sketch a chart that demonstrates the trends for sales and earnings, using 1997 as the base and showing 64 succeeding years as a percentage of the base year 65 Problem 5: 66 Percentage of Total Sales by Product 67 GS Products Company Company 69 A 15% 25. 30 70 8.40% 21.30 71 C 20.60% 19.90 72 D 16.20% 18.60 2.3 39 RON 14.ON 74 100.00% 100.00% 75 76 Sketch a chart that demonstrates how products sales mix differs between Company A and B 77 78 79 80 81 82 83 RE

Step by Step Solution

There are 3 Steps involved in it

1 Expert Approved Answer
Step: 1 Unlock blur-text-image
Question Has Been Solved by an Expert!

Get step-by-step solutions from verified subject matter experts

Step: 2 Unlock
Step: 3 Unlock

Students Have Also Explored These Related General Management Questions!