

Question: Problem 4. One - way ANOVA, completely randomized design (10 points) Four chemical plants, producing the same products and owned by the same company, discharge
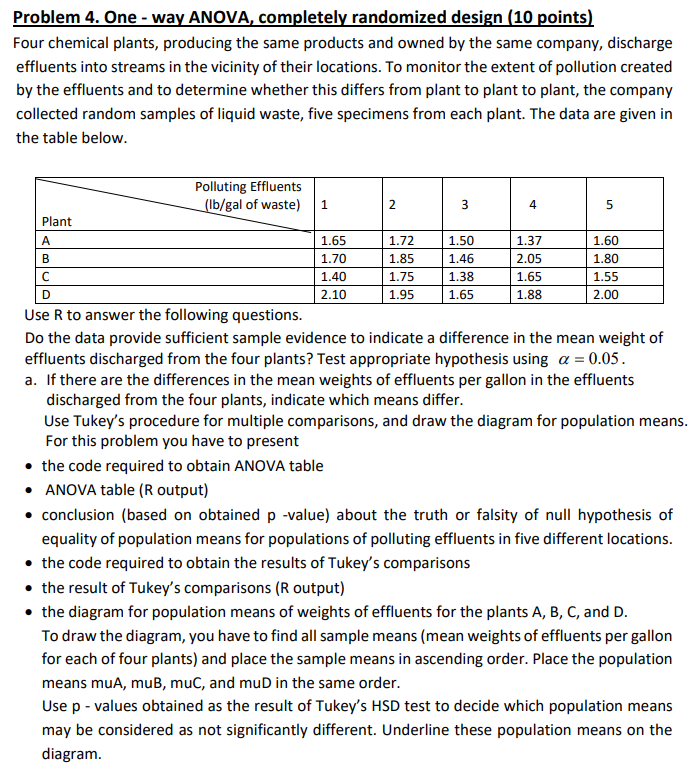
Problem 4. One - way ANOVA, completely randomized design (10 points) Four chemical plants, producing the same products and owned by the same company, discharge effluents into streams in the vicinity of their locations. To monitor the extent of pollution created by the effluents and to determine whether this differs from plant to plant to plant, the company collected random samples of liquid waste, five specimens from each plant. The data are given in the table below. Polluting Effluents (lb/gal of waste) 1 2 3 5 Plant A 1.65 1.72 1.50 1.37 1.60 B 1.70 1.85 1.46 2.05 1.80 C 1.40 1.75 1.38 1.65 1.55 D 2.10 1.95 1.65 1.88 2.00 Use R to answer the following questions. Do the data provide sufficient sample evidence to indicate a difference in the mean weight of effluents discharged from the four plants? Test appropriate hypothesis using a = 0.05. a. If there are the differences in the mean weights of effluents per gallon in the effluents discharged from the four plants, indicate which means differ. Use Tukey's procedure for multiple comparisons, and draw the diagram for population means. For this problem you have to present . the code required to obtain ANOVA table ANOVA table (R output) . conclusion (based on obtained p -value) about the truth or falsity of null hypothesis of equality of population means for populations of polluting effluents in five different locations. . the code required to obtain the results of Tukey's comparisons . the result of Tukey's comparisons (R output) . the diagram for population means of weights of effluents for the plants A, B, C, and D. To draw the diagram, you have to find all sample means (mean weights of effluents per gallon for each of four plants) and place the sample means in ascending order. Place the population means muA, muB, muc, and muD in the same order. Use p - values obtained as the result of Tukey's HSD test to decide which population means may be considered as not significantly different. Underline these population means on the diagram
Step by Step Solution
There are 3 Steps involved in it

Get step-by-step solutions from verified subject matter experts