

Question: Problem 4. SPSS 2 assignment data set contains Class information of 40 students. Frequencies (and %) of each class category are as follows: Freshman (
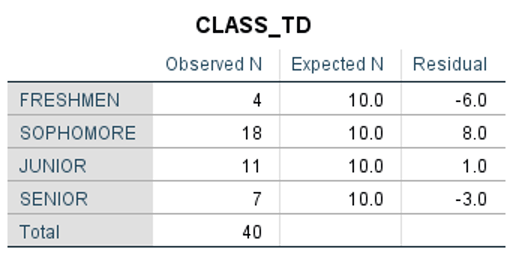
Problem 4.SPSS 2 assignment data set contains Class information of 40 students. Frequencies (and %) of each class category are as follows: Freshman (n = 4, 10%), Sophomore (n = 18, 45%), Junior (n = 11, 27.5%), and Senior (n = 7, 17.5%). If the proportion (or %) of class standing is equal, we expect the followings: Freshman (n = 10, 25%), Sophomore (n = 10, 25%), Junior (n = 10, 25%), and Senior (n = 10, 25%). Do the data indicate there are significant differences in the frequencies (or %) of class standing/categories? Run the chi-square goodness-of-fit test at a .05 level of significance.
I need helping figuring out the conclusion (which is step 4 in the hypothesis testing process) from my provided data.
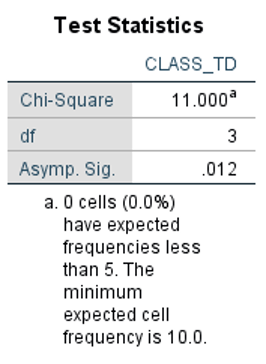
\fTest Statistics CLASS TD Chi-Square 11.000 df 3 Asymp. Sig. 012 a. 0 cells (0.0%) have expected frequencies less than 5. The minimum expected cell frequency is 10.0
Step by Step Solution
There are 3 Steps involved in it

Get step-by-step solutions from verified subject matter experts