

Question: Step 1: The Data Analysis Plan In Step 1: Name the four variables used in this analysis and whether they are categorical or continuous. State
Step 1: The Data Analysis Plan
In Step 1:
- Name the four variables used in this analysis and whether they are categorical or continuous.
- State a research question, null hypothesis, and alternate hypothesis for one X-Y pair. For example, you could articulate a research question, null hypothesis, and alternate hypothesis for quiz1 (X) and final (Y).
Step 2: Testing Assumptions
Test for one of the assumptions of correlation?normality.
- Create a descriptive statistics table in SPSS to assess normality. This table should include the four variables named above.
- Paste the table in the DAA Template.
- Interpret the skewness and kurtosis values and how you determined whether the assumption of normality was met or violated.
Step 3: Results and Interpretation
In Step 3:
- Paste the SPSS output of the intercorrelation matrix for all specified variables:
- First, report the lowest magnitude correlation in the intercorrelation matrix, including degrees of freedom, correlation coefficient, p value, and effect size. Interpret the effect size. Specify whether or not to reject the null hypothesis for this correlation.
- Second, report the highest magnitude correlation in the intercorrelation matrix, including degrees of freedom, correlation coefficient, p value, and effect size. Interpret the effect size. Specify whether or not to reject the null hypothesis for this correlation.
- Third, report the correlation between GPA and final, including degrees of freedom, correlation coefficient, p value, and effect size. Interpret the effect size. Analyze the correlation in terms of the null hypothesis.
- Interpret statistical results against the null hypothesis, and state whether it is accepted or rejected.
Step 4: Statistical Conclusions
In Step 4:
- Provide a brief summary of your analysis and the conclusions drawn.
- Analyze the limitations of the statistical test.
- Provide any possible alternate explanations for the findings and potential areas for future exploration.
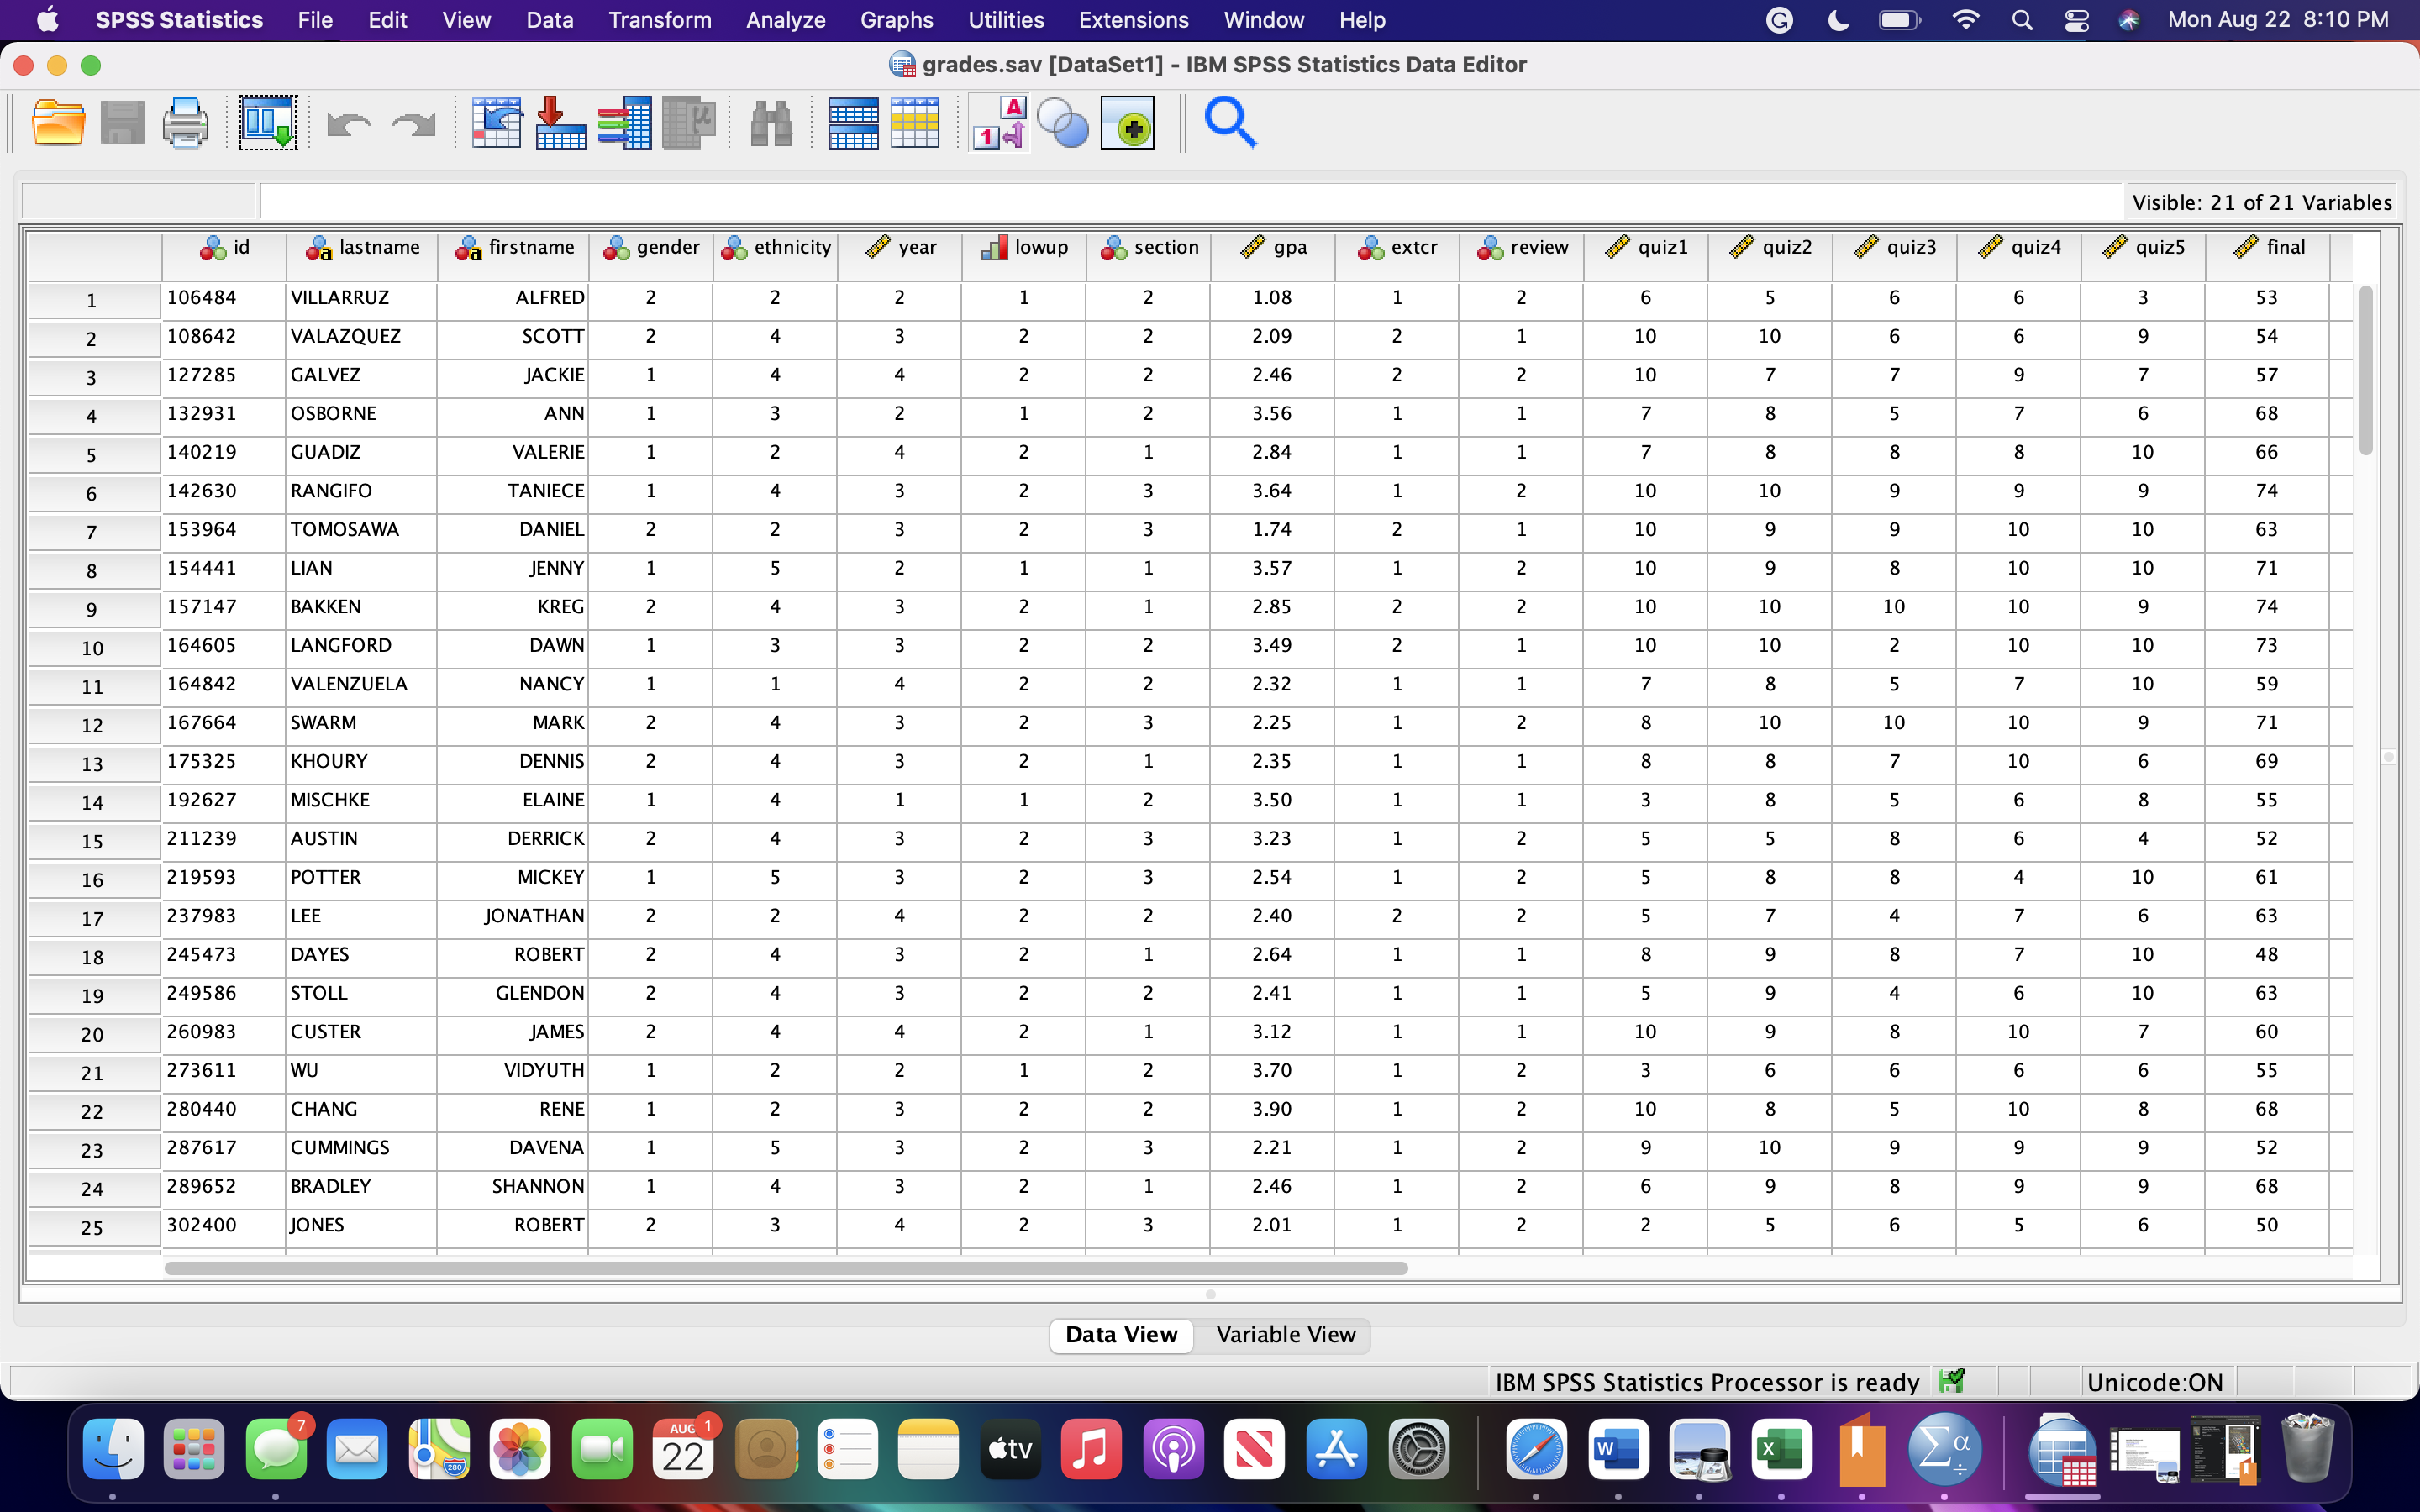
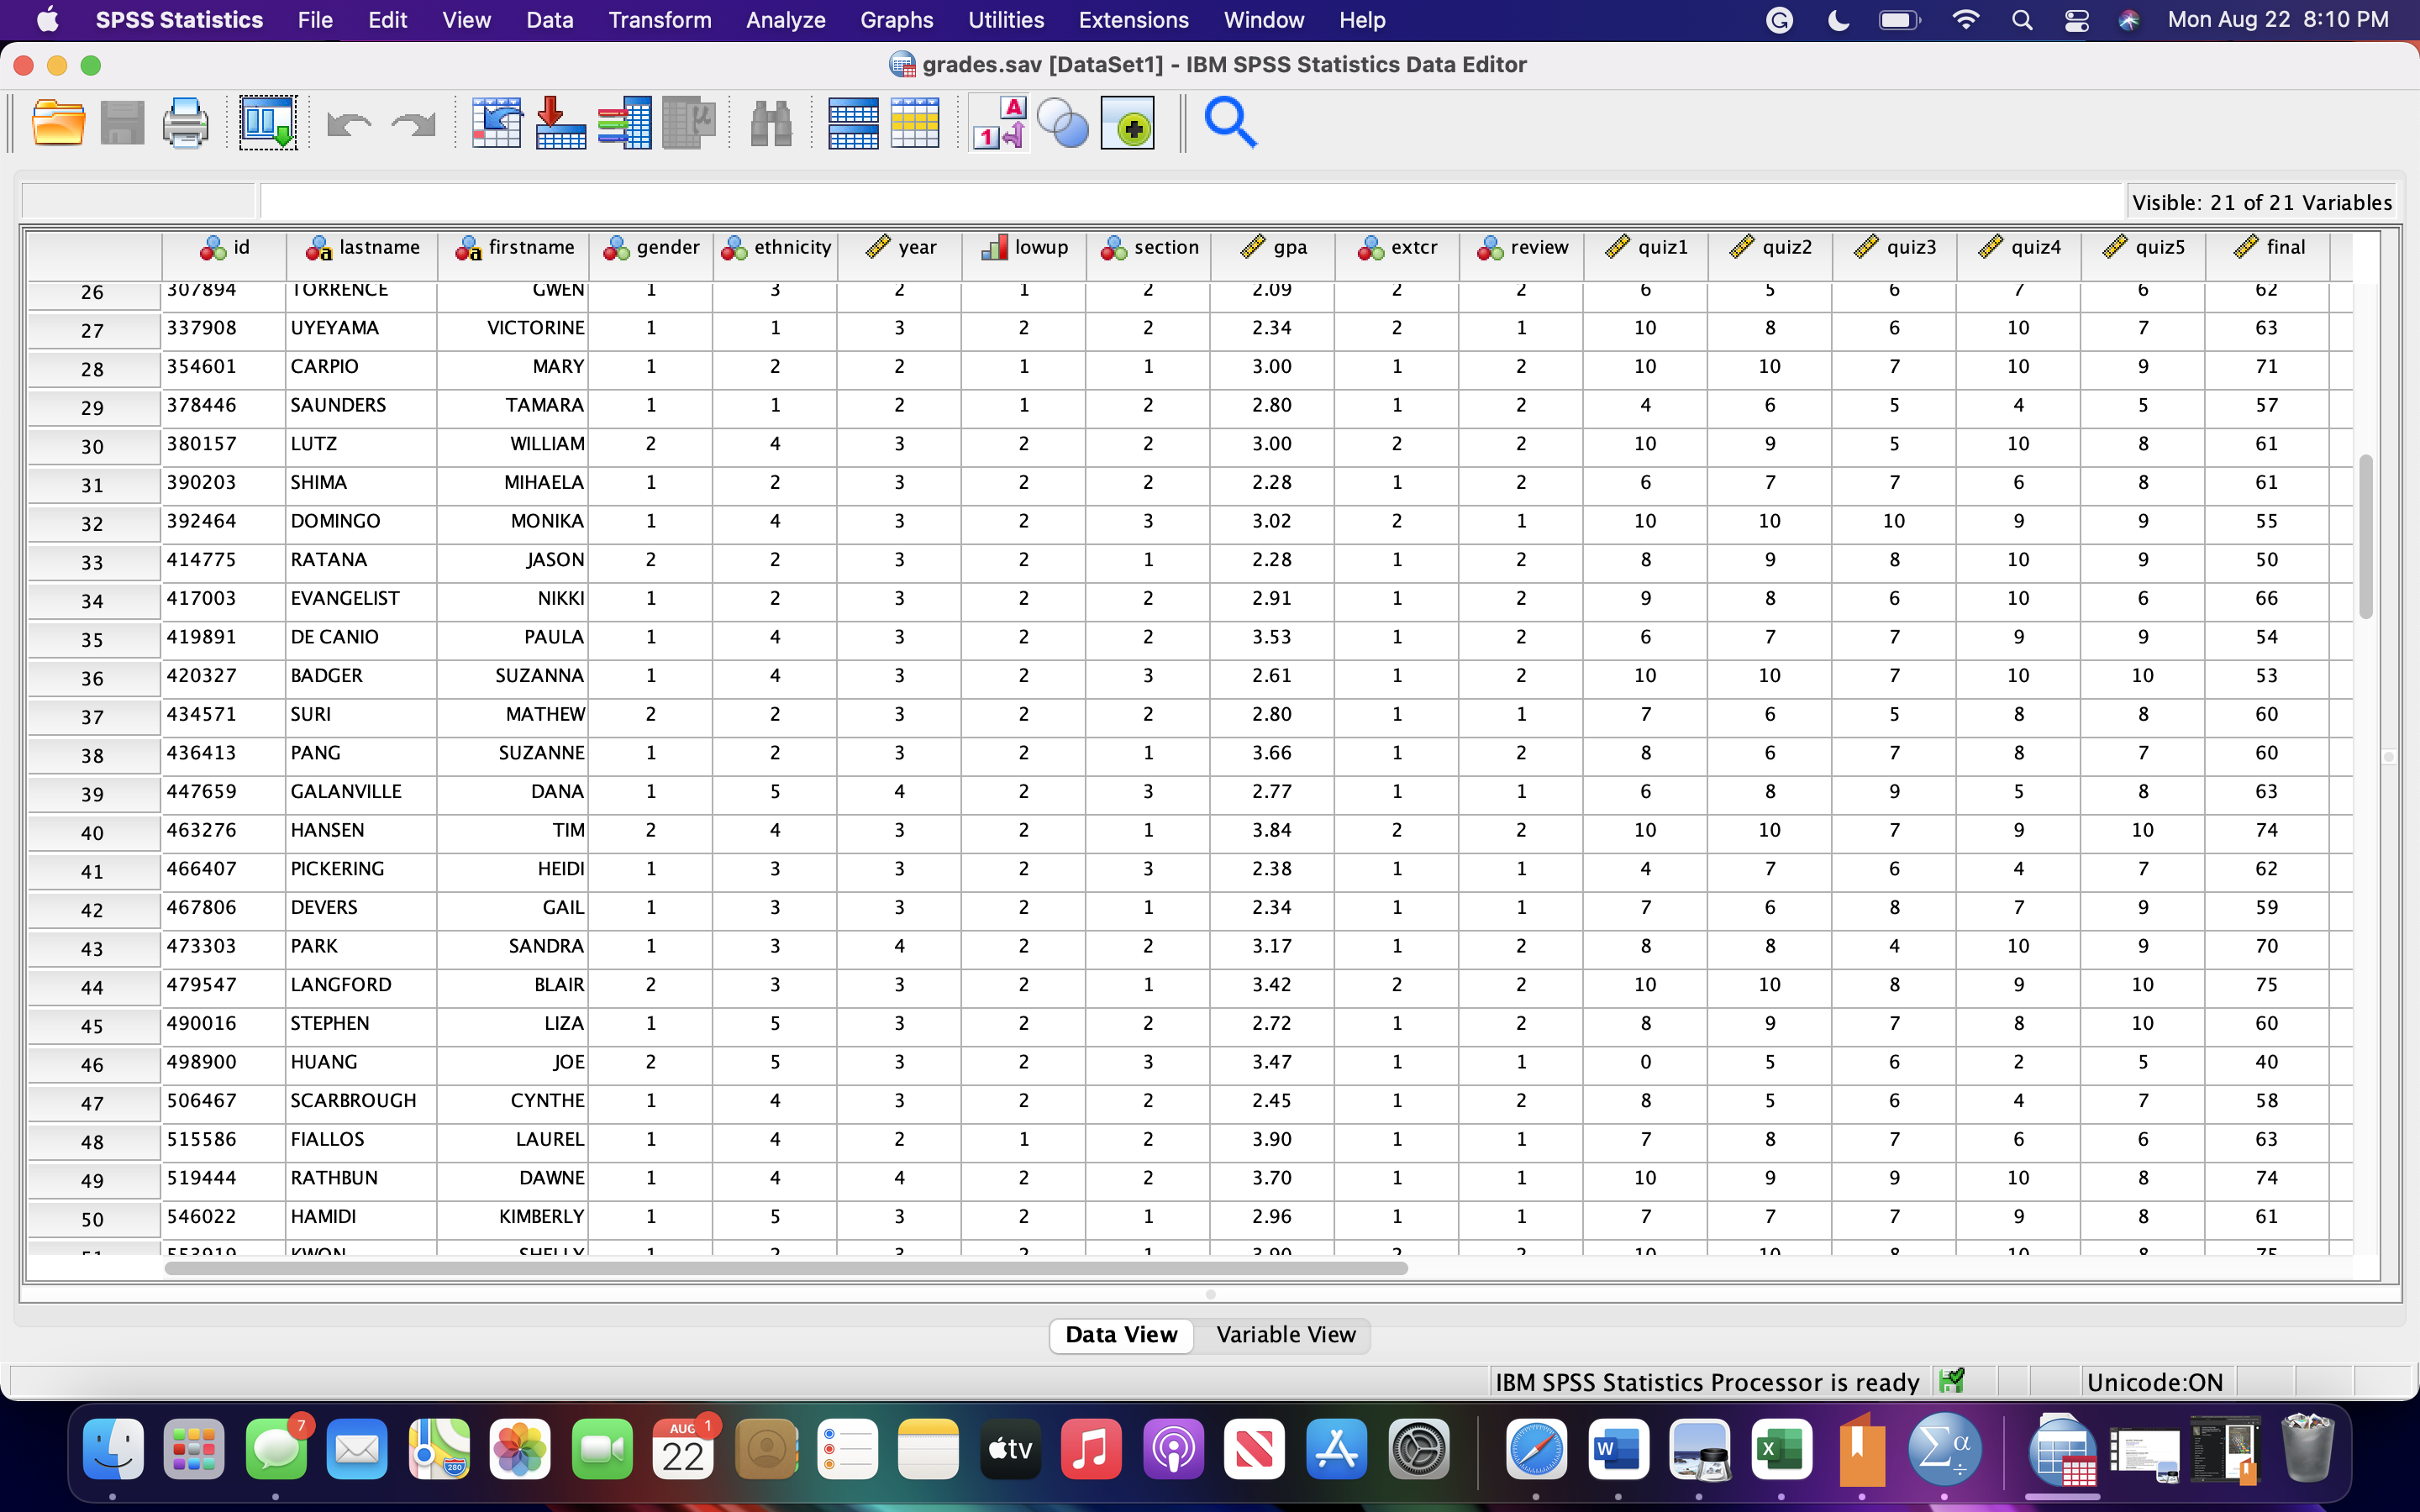

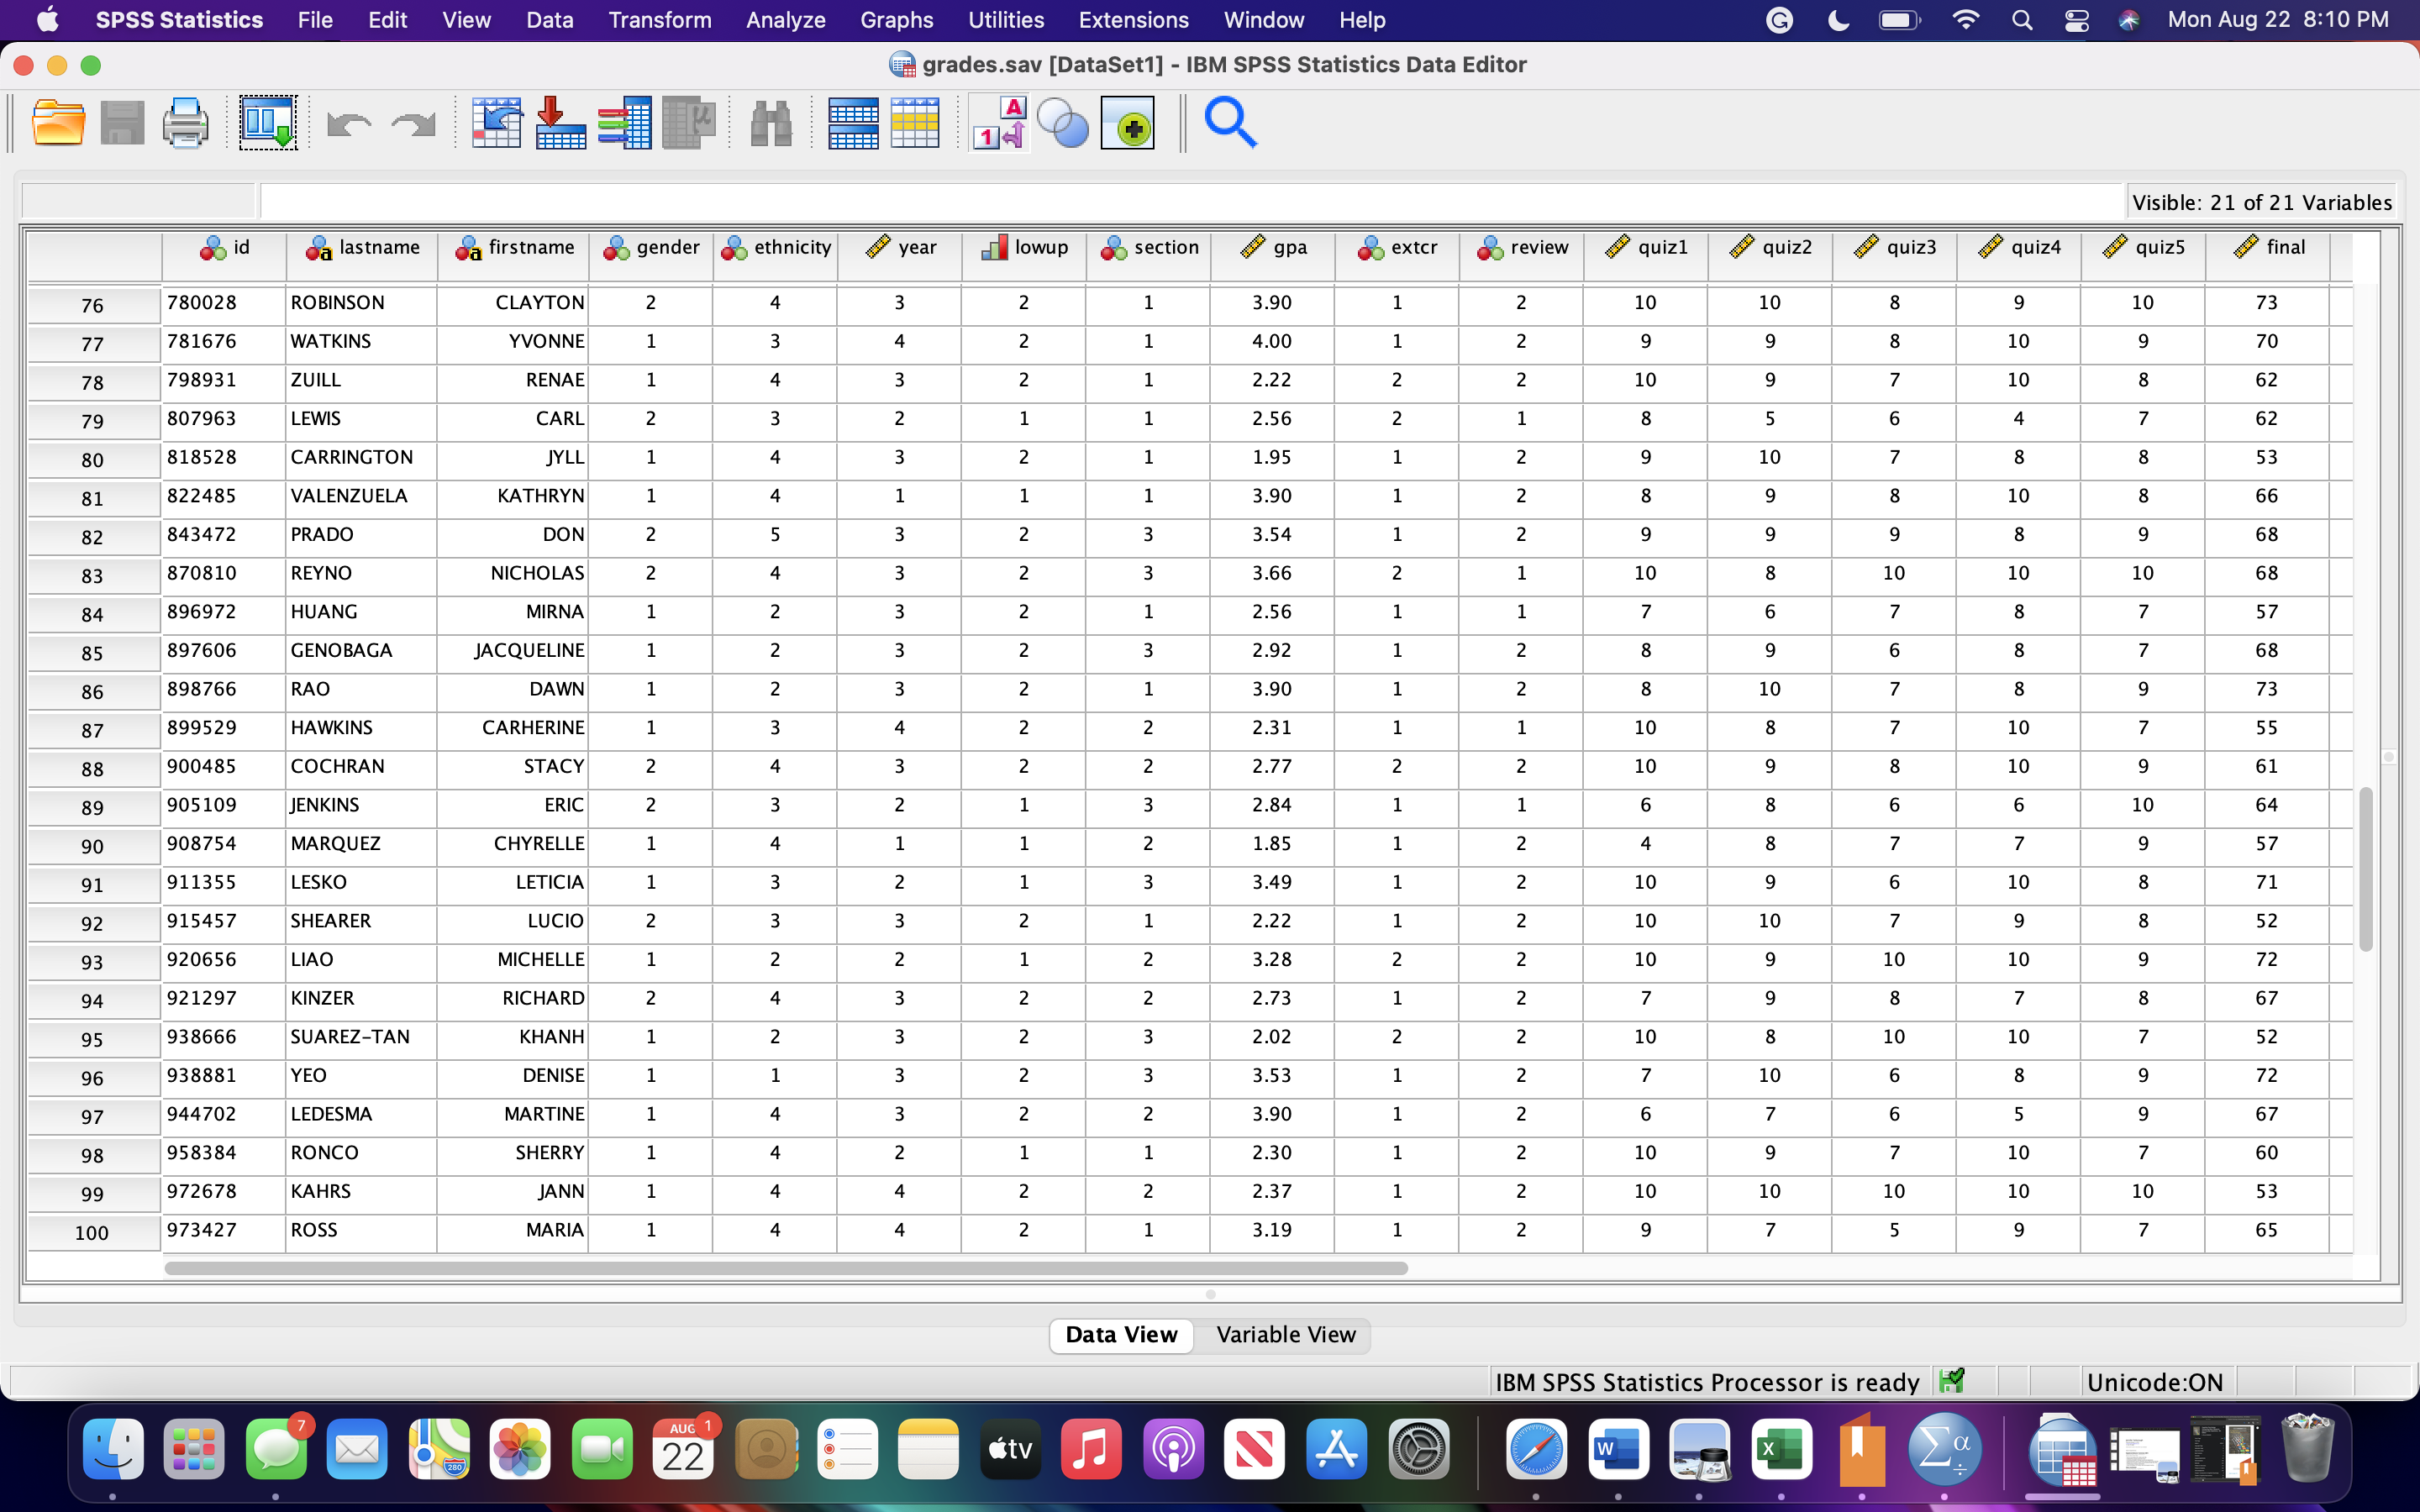
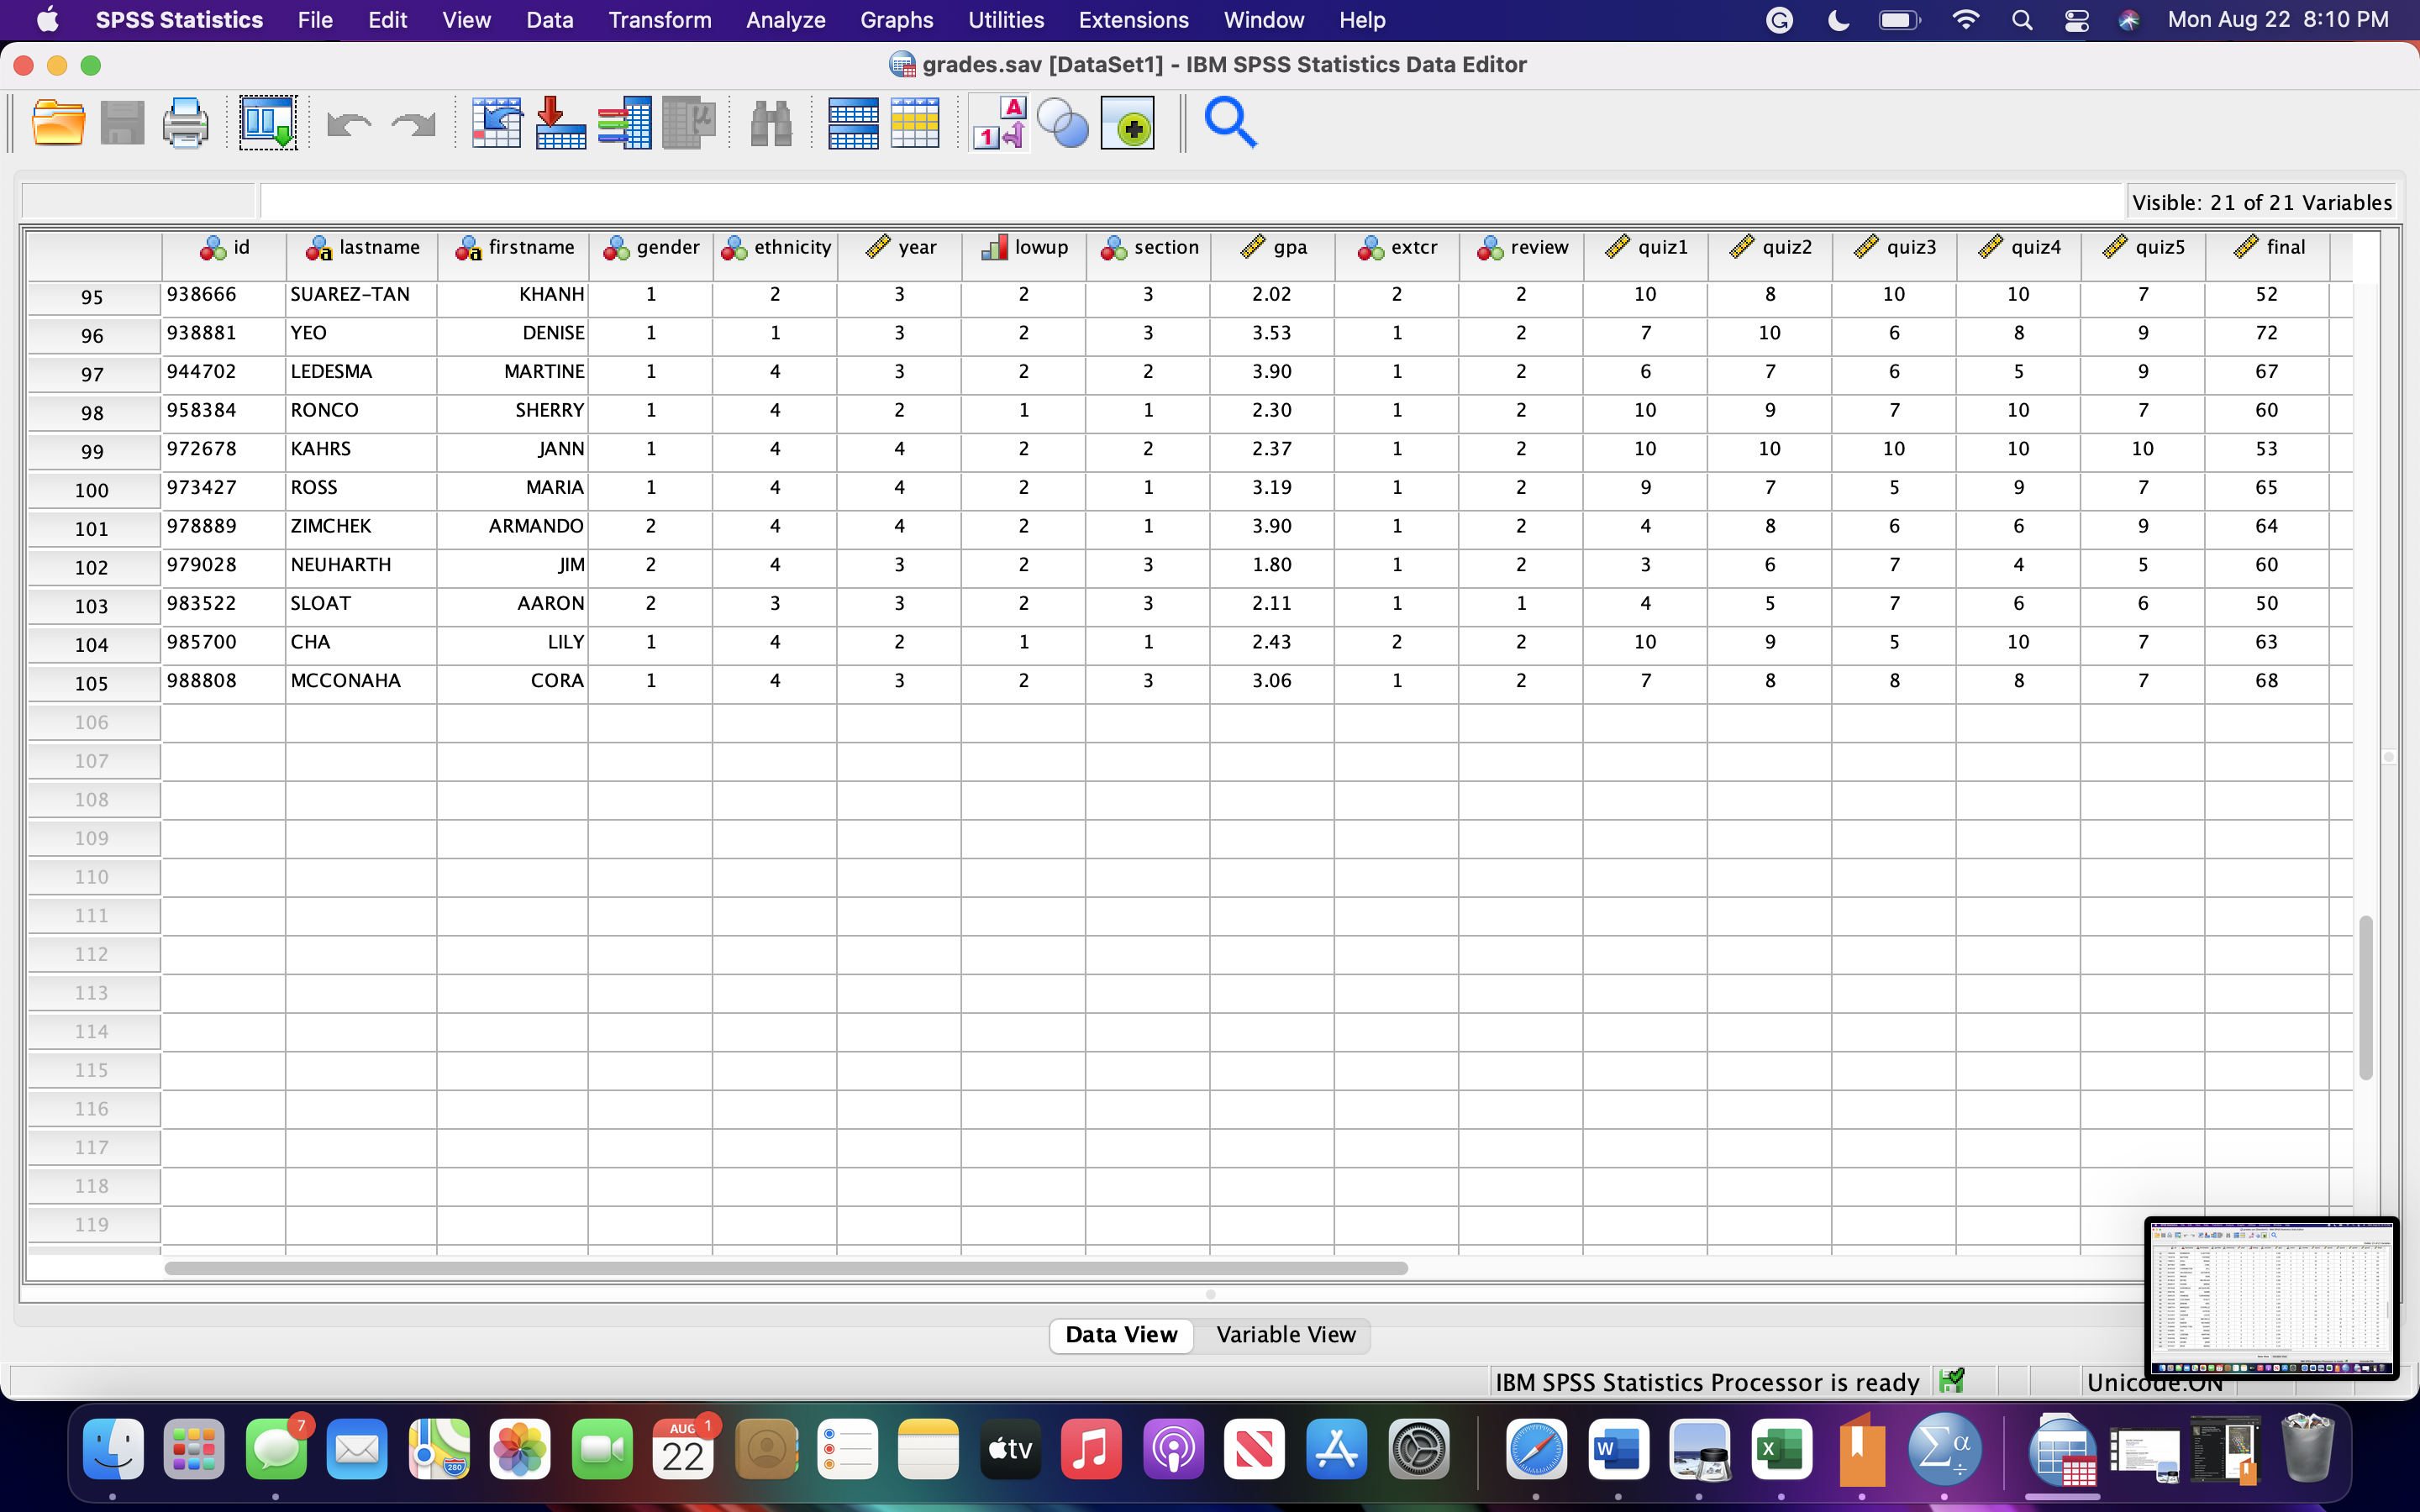
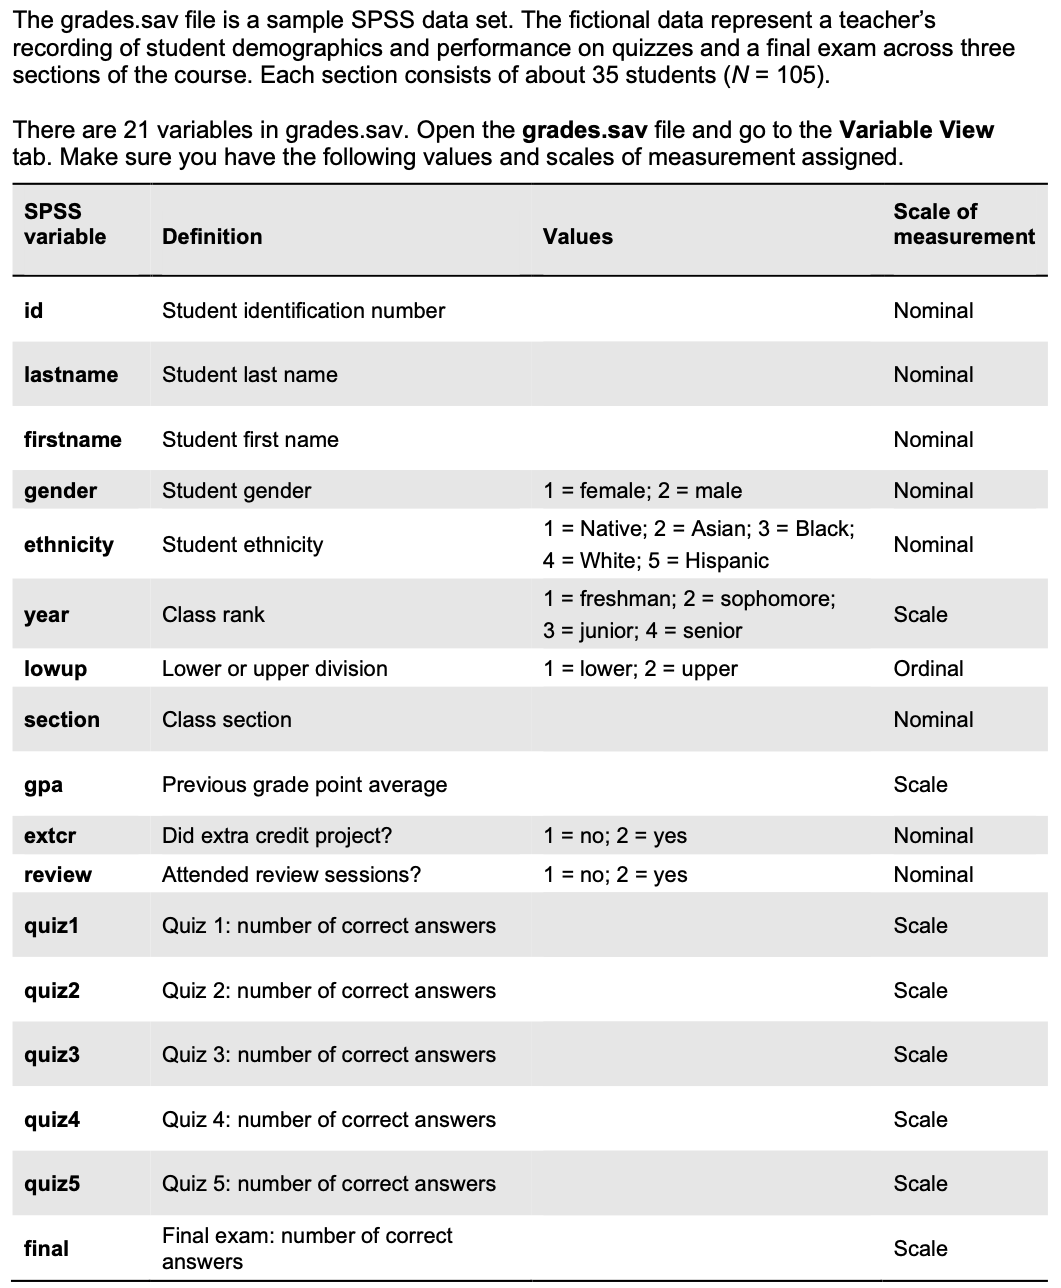
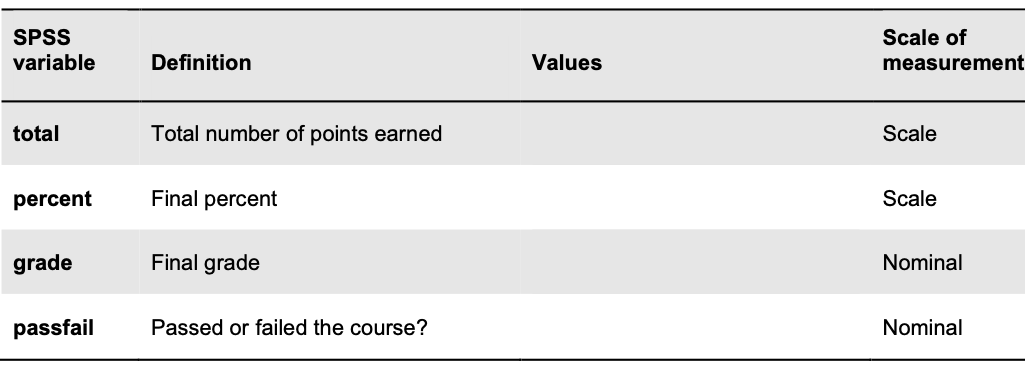
SPSS Statistics File Edit Data Transform Analyze Graphs Utilities Extensions Window Help G L O 7 Q 8 Mon Aug 22 8:10 PM grades.sav [DataSet1] - IBM SPSS Statistics Data Editor A + Q Visible: 21 of 21 Variables Bid Da lastname da firstname gender ethnicity year lowup section gpa o exter review quiz1 quizz quiz3 quiz4 quiz5 final 106484 VILLARRUZ ALFRED 2 2 1 1.08 2 6 5 6 6 3 53 IN 108642 VALAZQUEZ SCOTT N A 2.09 N 10 10 6 6 9 54 A W N N 127285 GALVEZ JACKIE 4 2.46 N N W 10 7 9 7 57 132931 OSBORNE ANN w 3.56 7 5 7 6 68 AN 00 00 UT 140219 GUADIZ VALERIE 2 H W W H N N N NN + 2.84 1 7 8 8 10 66 142630 RANGIFO TANIECE 4 3.64 2 10 10 9 9 9 74 w w 153964 TOMOSAWA DANIEL 2 2 1.74 1 10 10 10 63 NHNH 154441 LIAN JENNY 1 UT 3.57 10 10 10 71 9 157147 BAKKEN KREG 2 4 2.85 HNN 10 10 LO 74 10 16460 LANGFORD DAWN 1 5 N w/ 3.49 10 10 10 73 11 164842 VALENZUELA NANCY 2.32 10 59 00 NH 12 167664 SWARM MARK W W H W W A W W N 2.25 10 10 10 71 13 175325 KHOURY DENNIS N A 2.35 10 69 H H 14 192627 MISCHKE ELAINE 4 3.50 55 UI UT W 00 00 00 UT V N H 15 211239 AUSTIN DERRICK A 3.23 |00 U1 00 00 52 WNNNN NN WW NH WNNNN NNNH NNNNNN NN NN H N NN NN HN 16 219593 POTTER MICKEY 5 2.54 10 61 17 237983 LEE JONATHAN N N 2.40 63 V V 18 245473 DAYES ROBERT N 4 2.6 10 48 19 249586 STOLL GLENDON 2 4 2.41 6 10 63 20 260983 CUSTER JAMES N 4 3.12 NNHH - 10 60 W W W N A W W A W O 21 273611 WU VIDYUTH 1 N 3.70 55 22 280440 CHANG RENE 3.90 10 10 68 07 00 60 U1 01 00 23 287617 CUMMINGS DAVENA A UI N 2.21 10 52 24 289652 BRADLEY SHANNON 2.46 NNN 68 W + 25 302400 JONES ROBERT 2 3 2.01 50 Data View Variable View IBM SPSS Statistics Processor is ready . Unicode:ON AUG 1 22 tvSPSS Statistics File Edit Data Transform Analyze Graphs Utilities Extensions Window Help G L O 7 Q 8 Mon Aug 22 8:10 PM grades.sav [DataSet1] - IBM SPSS Statistics Data Editor A + Q Visible: 21 of 21 Variables id ba lastname oa firstname gender ethnicity year lowup section gpa o exter review quiz1 quizz quiz3 quiz4 quiz5 final 30/894 TORRENCE GWEN 2 2 2.09 6 6 62 26 5 33790 UYEYAMA VICTORINE 1 2 27 3 2 2.34 2 10 8 9 10 7 63 354601 CARPIO MARY 3.00 10 10 7 10 9 71 N 28 4 5 57 29 378446 SAUNDERS TAMARA 1 NNN 4 W N N 2.80 5 NH 30 380157 LUTZ WILLIAM 2 4 3.00 10 10 8 61 VU 31 390203 SHIMA MIHAELA 2 w 2.28 2 6 6 8 61 9 55 32 392464 DOMINGO MONIKA 1 4 3.02 10 10 10 9 N H 33 414775 RATANA JASON 2 2 2.28 10 50 EVANGELIST NIKKI 2.9 10 66 N 34 417003 H w w w w w 419891 PAULA 3.5 54 35 DE CANIO 9 A HNNN 53 36 420327 BADGER SUZANNA 2.61 10 10 60 SURI MATHEW N 2.80 37 434571 00 00 VU w w UI N N A N PANC SUZANNE 3.66 1 00 V 60 38 436413 NHNNNN NN NN NN NN NN NN NN H H 63 DANA HNNN W N H N H W H W H N W N N H W NNNN 39 447659 GALANVILLE 2.77 HANSEN TIM 4 3.8 10 10 10 74 40 463276 N 466407 PICKERING HEID 62 - W W W A 41 2.38 w w V OO V A 59 42 467806 DEVERS GAIL 2.34 00 7 43 473303 PARK SANDRA 3.17 10 70 HNNN HP UT W W 10 75 44 479547 LANGFORD BLAIR 10 10 N 3.42 10 60 45 490016 STEPHEN LIZA 1 2.72 A N CO 60 00 0 00 498900 40 46 HUANG JOE N 3.47 - N W W W W 58 47 506467 SCARBROUGH CYNTHE A AUT 2.45 N H 6 00 UT UT LO 3.90 63 0 00 00 7 V UT 48 51558 FIALLOS LAUREL DAWNE 3.70 10 10 74 49 519444 RATHBUN UI A O V 6 HAMIDI KIMBERLY 2.96 61 w N 50 546022 CUCI IV In In VWON on Data View Variable View IBM SPSS Statistics Processor is ready . Unicode:ON AUG 1 22 tvSPSS Statistics File Edit Data Transform Analyze Graphs Utilities Extensions Window Help G LO 7 Q 8 Mon Aug 22 8:10 PM grades.sav [DataSet1] - IBM SPSS Statistics Data Editor A + Q Visible: 21 of 21 Variables id oa lastname da firstname gender ethnicity year lowup section gpa exter review quiz1 quizz quiz3 quiz4 quiz5 final 51 553919 KWON SHELLY 1 2 3 2 1 3.90 2 2 10 LO 8 10 8 75 52 554809 JONES LISA 1 w 3.35 7 9 9 69 N W - N 53 574170 HURRIA WAYNE 2 1 3.84 6 6 6 48 00 UT 54 576008 BULMERKA HUSIBA 1 4 A 3.45 N 10 9 7 68 55 576141 MISHALANY LUCY 1 4 3 3.57 1 2 0 5 2 2 42 56 594463 CRUZADO MARITESS 4 3.05 or 00 W 00 N 8 65 H H 57 595177 WILLIAMS OLIMPIA 3 1.24 10 10 5 53 W W W A 58 615115 VASENIUS RUSS N w 3.77 59 59 616095 SPRINGER ANNELIES 4 3.6 10 10 10 10 10 72 NNNNN NN NN NN 60 623857 CORTEZ VIKKI 2.56 58 - W 61 664653 KHAN JOHN U NUT N 1.24 59 00 NNNNNNNN - 00 UT W UT 62 681855 GRISWOLD TAMMY 4 1.50 57 63 70097 WEBSTER DEANNA 1 3 3.90 LO 10 10 67 H W N N H W N N H N W W W N W W H W W N H W N W 64 703740 SUNYA DALE 2 3.58 10 10 10 V 62 65 721311 SONG LOIS N 1.61 10 64 N N 66 725987 BATILLER FRED N 1.77 70 A W N N W W W N W W N W W A 67 737728 BELTRAN JIM 00 V UT N w 2.57 62 00 On 68 755724 LANGFORD TREVOR N 4 2.96 62 NNN - 69 756097 KURSEE JACKIE 3.13 00 60 V 1 60 00 V 10 66 00 LO A W 70 762308 GOUW BONNIE 3.90 10 00 57 NNNNHHNNN+ HNHP 71 762813 DAEL IVAN N 2.27 10 10 10 62 72 765360 ROBINSON ERIC - W W N 2.43 10 65 N H H N N 73 768995 DUMITRESCU STACY 2 2.88 W V OO 10 N 60 0O 10 60 a O V V 74 777683 ANDERSON ERIC N 2.40 50 W A A O 75 779481 AHGHEL BRENDA 1 3.01 2 49 Data View Variable View IBM SPSS Statistics Processor is ready . Unicode:ON 7 AUG 1 22 Of tvSPSS Statistics File Edit Data Transform Analyze Graphs Utilities Extensions Window Help G LO 7 Q 8 Mon Aug 22 8:10 PM grades.sav [DataSet1] - IBM SPSS Statistics Data Editor A + Q Visible: 21 of 21 Variables Bid oa lastname da firstname gender ethnicity year lowup section gpa go exter review quiz1 quizz quiz3 quiz4 quiz5 final 76 780028 ROBINSON CLAYTON 2 4 3 2 1 3.90 1 2 10 10 8 9 10 73 77 781676 WATKINS YVONNE 1 3 4.00 N 9 10 9 70 NN W A 78 798931 ZUILL RENA 1 4 2.22 10 10 8 62 - N HNNH 79 807963 LEWIS CARL 2 3 2.56 8 4 7 62 W N N - 80 818528 CARRINGTON JYLL 1 4 1.95 10 8 8 53 322485 VALENZUELA KATHRYN 4 3.90 NNN 1 00 60 81 10 66 10 00 82 843472 PRADO DON 2 5 3.54 68 w w W H 51 83 870810 REYNO NICHOLAS A N 3.66 10 10 10 68 H N 84 896972 HUANG MIRNA 2 2.56 57 897606 00 00 85 GENOBAGA JACQUELINE 2.92 68 00 00 NUNN HH 898766 3.90 O V O V V 86 RAO DAWN 10 73 A W N N 87 899529 HAWKINS CARHERINE 2.31 10 10 55 10 00 CO V V 88 900485 COCHRAN STACY N 2.77 10 10 61 89 905109 JENKINS ERIC 2 2.84 10 64 A O A W 90 908754 MARQUEZ CHYRELLE H 1.85 57 -NH N W W N N H W N W N N H W H W W H 91 911355 LESKO LETICIA NNNN H N N H N N N N H N H H H N N N N N N N 3.49 10 10 71 w w W W WW NWNH NW A 92 915457 SHEARER LUCIC N 2.22 10 52 93 920656 IAC MICHELLE 2 3.28 10 10 10 72 V V Oo A 67 94 921297 KINZER RICHARD N 2.73 NN 95 938666 SUAREZ-TAN KHANH 2 2.02 10 8 10 10 52 96 938881 YEC DENISE 3.53 10 72 O V 97 944702 LEDESMA MARTINE 3.90 67 NNNNN 98 958384 RONCO SHERRY 2.30 10 10 60 A A 99 972678 KAHRS JANN 2.37 10 10 10 10 10 53 UT 100 973427 ROSS MARIA 1 4 3.19 7 7 65 Data View Variable View IBM SPSS Statistics Processor is ready . Unicode:ON AUG 1 22 Of tvSPSS Statistics File Edit Data Transform Analyze Graphs Utilities Extensions Window Help G L O 7 Q 8 Mon Aug 22 8:10 PM grades.sav [DataSet1] - IBM SPSS Statistics Data Editor A + Visible: 21 of 21 Variables id ba lastname oa firstname gender ethnicity year lowup section gpa exter review quiz1 quizz quiz3 quiz4 quiz5 final 95 938666 SUAREZ-TAN KHANH 2 3 2 3 2.02 2 2 10 8 10 10 52 96 938881 YEO DENISE 1 3.53 1 IN 7 10 6 8 9 72 97 944702 LEDESMA MARTINE 1 4 3.90 N 6 5 67 NUNN 98 958384 RONCO SHERRY 1 4 A ANWW 2.30 10 10 60 99 972678 KAHRS JANN 1 4 2.37 10 10 10 10 10 53 100 973427 ROSS MARIA 1 4 3.19 NNNNN 9 UT 9 7 65 101 978889 ZIMCHEK ARMANDO 4 HWWHENI N 3.90 64 102 979028 NEUHARTH JIM N 4 1.80 A W A 60 H N N N N 00 60 U1 1 00 V 983522 W N W W A 103 SLOAT AARON N 2.11 50 104 985700 CHA LILY 4 00 UT V 2.43 10 10 63 105 988808 MCCONAHA CORA 1 A 3.06 8 68 106 107 108 109 110 111 112 113 114 115 116 117 118 119 Data View Variable View IBM SPSS Statistics Processor is ready Unicoue.ON 13 8 22 AUG 1 EThe grades.sav file is a sample SPSS data set. The fictional data represent a teacher's recording of student demographics and performance on quizzes and a final exam across three sections of the course. Each section consists of about 35 students (N = 105). There are 21 variables in grades.sav. Open the grades.sav file and go to the Variable View tab. Make sure you have the following values and scales of measurement assigned SPSS Scale of variable Definition Values measurement id Student identification number Nominal lastname Student last name Nominal firstname Student first name Nominal gender Student gender 1 = female; 2 = male Nominal 1 = Native; 2 = Asian; 3 = Black; ethnicity Student ethnicity Nominal 4 = White; 5 = Hispanic 1 = freshman; 2 = sophomore; year Class rank Scale 3 = junior; 4 = senior lowup Lower or upper division 1 = lower; 2 = upper Ordinal section Class section Nominal gpa Previous grade point average Scale exter Did extra credit project? 1 = no; 2 = yes Nominal review Attended review sessions? 1 = no; 2 = yes Nominal quiz1 Quiz 1: number of correct answers Scale quiz2 Quiz 2: number of correct answers Scale quiz3 Quiz 3: number of correct answers Scale quiz4 Quiz 4: number of correct answers Scale quiz5 Quiz 5: number of correct answers Scale final Final exam: number of correct Scale answersSPSS Scale of variable Definition Values measurement total Total number of points earned Scale percent Final percent Scale grade Final grade Nominal passfail Passed or failed the course? Nominal
Step by Step Solution
There are 3 Steps involved in it

Get step-by-step solutions from verified subject matter experts