

Question: Problem 4 : The figure represents the infiltration rate curve as described by Horton infiltration method, answer the followings based on this figure: What is
Problem :
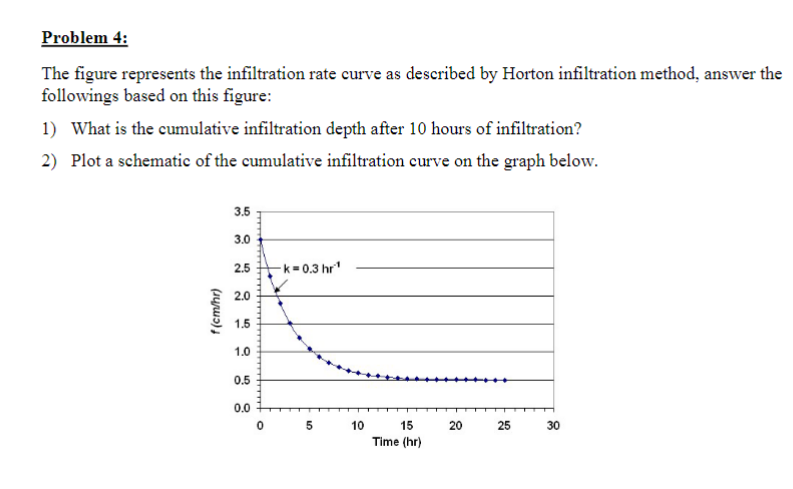
The figure represents the infiltration rate curve as described by Horton infiltration method, answer the
followings based on this figure:
What is the cumulative infiltration depth after hours of infiltration?
Plot a schematic of the cumulative infiltration curve on the graph below.
Step by Step Solution
There are 3 Steps involved in it
1 Expert Approved Answer
Step: 1 Unlock

Question Has Been Solved by an Expert!
Get step-by-step solutions from verified subject matter experts
Step: 2 Unlock
Step: 3 Unlock