

Question: Problem 4. The figures below show the difference in sea level between today and 1880 plotted against the anomaly in sea surface temperature (relative to
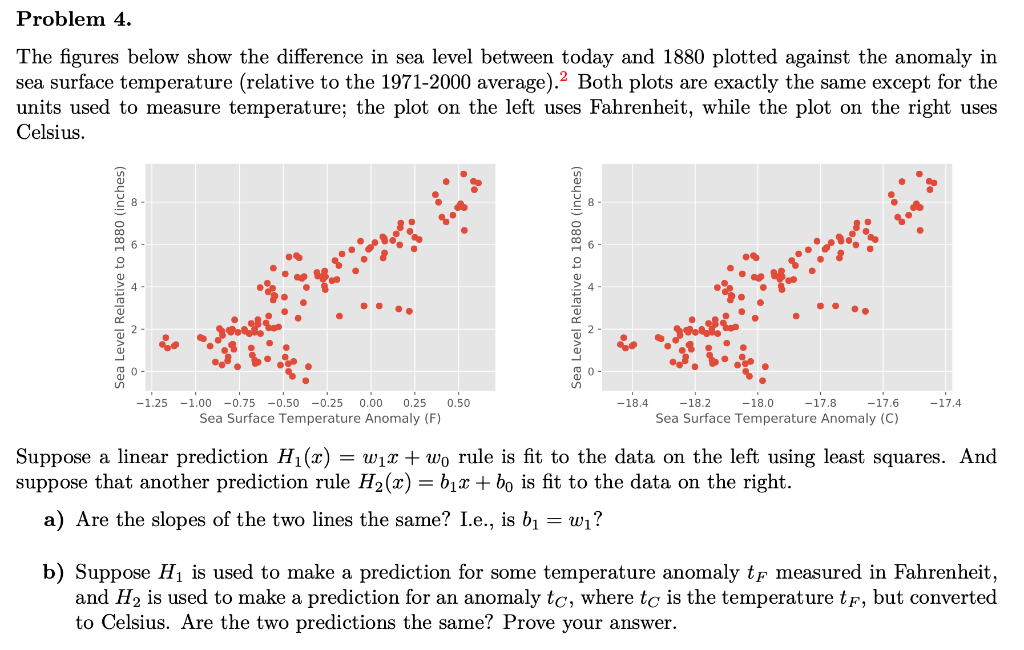
Problem 4. The figures below show the difference in sea level between today and 1880 plotted against the anomaly in sea surface temperature (relative to the 1971-2000 average). Both plots are exactly the same except for the units used to measure temperature; the plot on the left uses Fahrenheit, while the plot on the right uses Celsius. Sea Level Relative to 1880 (inches) Sea Level Relative to 1880 (inches) -1.25 0.50 -18.4 -17.4 -1.00 -0.75 -0.50 -0.25 0.00 0.25 Sea Surface Temperature Anomaly (F) -18.2 -18.0 -17.8 -17.6 Sea Surface Temperature Anomaly (C) Suppose a linear prediction Hix) = W12 + wo rule is fit to the data on the left using least squares. And suppose that another prediction rule H (2) = 61X + bo is fit to the data on the right. a) Are the slopes of the two lines the same? I.e., is b = wi? b) Suppose H1 is used to make a prediction for some temperature anomaly tf measured in Fahrenheit, and H, is used to make a prediction for an anomaly tc, where tc is the temperature tf, but converted to Celsius. Are the two predictions the same? Prove your answer. Problem 4. The figures below show the difference in sea level between today and 1880 plotted against the anomaly in sea surface temperature (relative to the 1971-2000 average). Both plots are exactly the same except for the units used to measure temperature; the plot on the left uses Fahrenheit, while the plot on the right uses Celsius. Sea Level Relative to 1880 (inches) Sea Level Relative to 1880 (inches) -1.25 0.50 -18.4 -17.4 -1.00 -0.75 -0.50 -0.25 0.00 0.25 Sea Surface Temperature Anomaly (F) -18.2 -18.0 -17.8 -17.6 Sea Surface Temperature Anomaly (C) Suppose a linear prediction Hix) = W12 + wo rule is fit to the data on the left using least squares. And suppose that another prediction rule H (2) = 61X + bo is fit to the data on the right. a) Are the slopes of the two lines the same? I.e., is b = wi? b) Suppose H1 is used to make a prediction for some temperature anomaly tf measured in Fahrenheit, and H, is used to make a prediction for an anomaly tc, where tc is the temperature tf, but converted to Celsius. Are the two predictions the same? Prove your
Step by Step Solution
There are 3 Steps involved in it

Get step-by-step solutions from verified subject matter experts