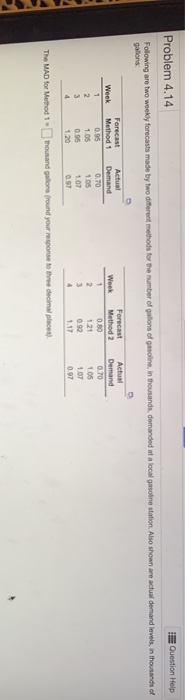
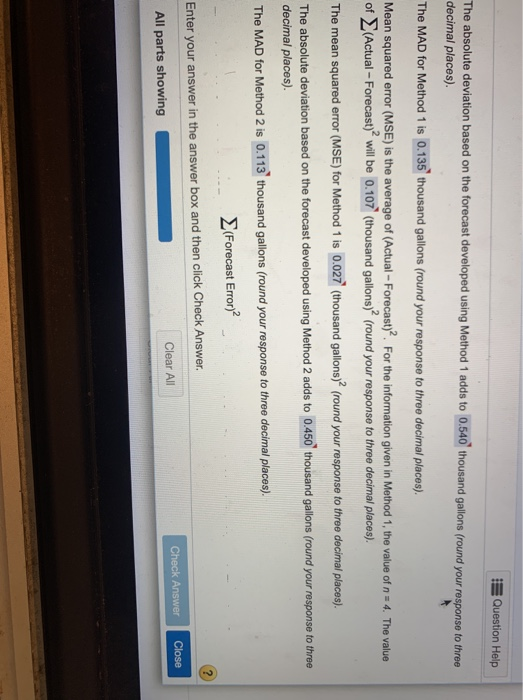
Question: Problem 4.14 Question Help Following are two weekly forecasts made by two different methods for the number of gallons of gasoline, in thousands, demanded at

Problem 4.14 Question Help Following are two
Problem 4.14 Question Help Following are two weekly forecasts made by two different methods for the number of gallons of gasoline, in thousands, demanded at a local gasoline station. Also shown are actual demand levels in thousands of gallons Actual Demand 0.70 Forecast Method 2 Week 1 2 3 4 Forecast Method 1 0.95 1.05 0.95 1.20 Week 1 2 3 4 Actual Demand 0.70 105 1 07 0.97 1.21 0.92 1.17 107 097 The MAD for Method 1 - Thousand gallons (round your response to three decimal places) Question Help The absolute deviation based on the forecast developed using Method 1 adds to 0.540 thousand gallons (round your response to three decimal places) The MAD for Method 1 is 0.135 thousand gallons (round your response to three decimal places). Mean squared error (MSE) is the average of (Actual - Forecast). For the information given in Method 1, the value of n = 4. The value of (Actual - Forecast)? will be 0.107" (thousand gallons)? (round your response to three decimal places). The mean squared error (MSE) for Method 1 is 0.027 (thousand gallons)? (round your response to three decimal places). The absolute deviation based on the forecast developed using Method 2 adds to 0.450 thousand gallons (round your response to three decimal places). The MAD for Method 2 is 0.113 thousand gallons (round your response to three decimal places). (Forecast Error) Enter your answer in the answer box and then click Check Answer. Close Check Answer Clear All All parts showing

Step by Step Solution

There are 3 Steps involved in it

1 Expert Approved Answer
Step: 1 Unlock blur-text-image
Question Has Been Solved by an Expert!

Get step-by-step solutions from verified subject matter experts

Step: 2 Unlock
Step: 3 Unlock

Students Have Also Explored These Related General Management Questions!