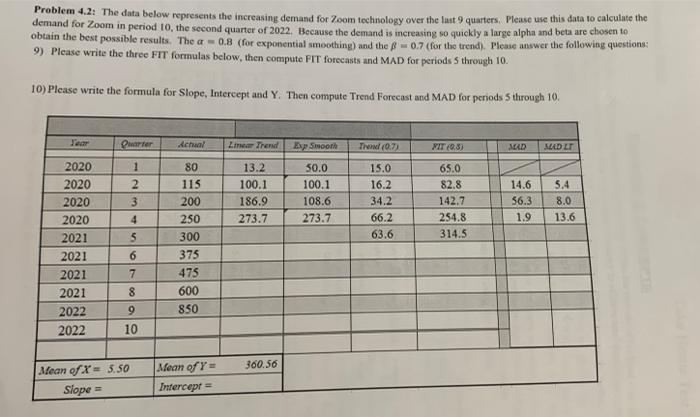
Question: Problem 4.2: The data below represents the increasing demand for 7 oom technology over the last 9 quarters, Please use this data to calculate the

Problem 4.2: The data below represents the
Problem 4.2: The data below represents the increasing demand for 7 oom technology over the last 9 quarters, Please use this data to calculate the demand for Zoom in period 10, the second quarter of 2022 . Because the demand is increasing so quickly a large alpha and beta are chosen to obtain the best possible results. The =0.8 (for exponential smoothing) and the =0.7 (for the trend). Please answer the following questions: 9) Please write the three FIT formulas below, then compute FT forecasts and MAD for periods 5 through 10 . 10) Please write the formula for Slope, Intercept and Y. Then conpute Trend Forecast and MAD for periods 5 through 10

Step by Step Solution

There are 3 Steps involved in it

1 Expert Approved Answer
Step: 1 Unlock blur-text-image
Question Has Been Solved by an Expert!

Get step-by-step solutions from verified subject matter experts

Step: 2 Unlock
Step: 3 Unlock

Students Have Also Explored These Related General Management Questions!