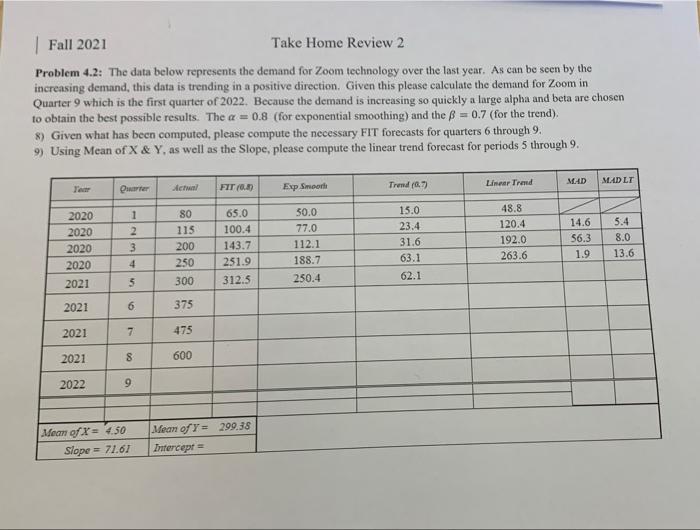
Question: Fall 2021 Take Home Review 2 Problem 4.2: The data below represents the demand for Zoom technology over the last year. As can be seen

Fall 2021 Take Home Review 2 Problem 4.2: The
Fall 2021 Take Home Review 2 Problem 4.2: The data below represents the demand for Zoom technology over the last year. As can be seen by the increasing demand, this data is trending in a positive direction. Given this please calculate the demand for Zoom in Quarter 9 which is the first quarter of 2022. Because the demand is increasing so quickly a large alpha and beta are chosen to obtain the best possible results. The a=0.8 (for exponential smoothing) and the B = 0.7 (for the trend) 8) Given what has been computed, please compute the necessary FIT forecasts for quarters 6 through 9. 9) Using Mean of X & Y, as well as the Slope, please compute the linear trend forecast for periods 5 through 9. MAD MAD LT Linear Trad Tear Quarter Acum FIT (0. Trend (0.7) Exp Smooth 2020 2020 2020 2020 2021 1 2 3 4 80 115 200 2.50 300 14.6 56.3 65.0 100.4 143.7 251.9 312.5 50.0 77.0 112.1 188.7 250.4 15.0 23.4 31.6 63.1 62.1 48.8 120.4 192.0 263.6 5.4 8.0 13.6 1.9 5 2021 6 375 2021 7 475 2021 8 600 2022 9 Mean of X= 4.50 Slope = 71.61 Mean of Y = 299.38 Intercept =

Step by Step Solution

There are 3 Steps involved in it

1 Expert Approved Answer
Step: 1 Unlock blur-text-image
Question Has Been Solved by an Expert!

Get step-by-step solutions from verified subject matter experts

Step: 2 Unlock
Step: 3 Unlock

Students Have Also Explored These Related General Management Questions!