

Question: Problem 4-42 Spreadsheet Problem Oil prices have increased a great deal in the last decade. The following table shows the average oil price for each
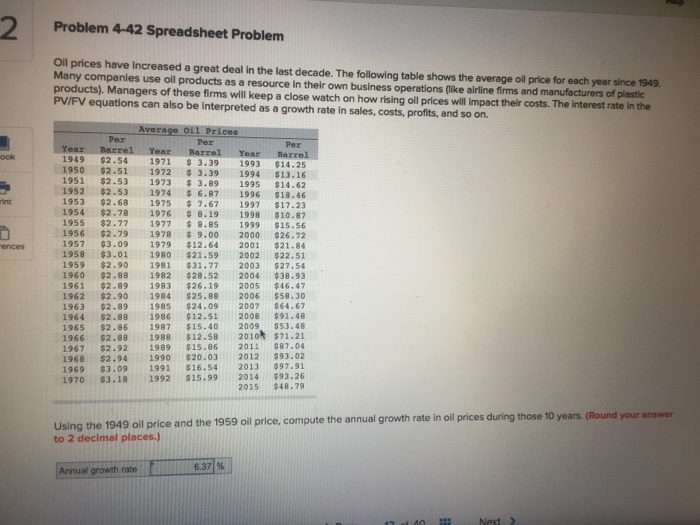
Problem 4-42 Spreadsheet Problem Oil prices have increased a great deal in the last decade. The following table shows the average oil price for each year since 1949 Many companies use oll products as a resource in their own business operations (like airline firms and manufacturers of plastic products) Managers of these firms will keep a close watch on how rising oil prices will Impact their costs. The interest rate in the PV/FV equations can also be interpreted as a growth rate in sales, costs, profits, and so on Average 011 Prices Per Per Per Year ook 1949 $2.54 1971 3.39 1993 $14.25 1950 $2.51 1972 3.39 1994 $13.16 1951 $2.53 1973 3.89 1995 $14.62 1952 $2.53 1974 $6.87 1996 $18.46 1953 $2.68 1975 $ 7.67 1997 $17.23 1954 $2.78 1976 8.19 1998 $10.87 1955 $2.77 1977 8.85 1999 $15.56 1956 $2.79 1978 9.00 2000 $26.72 1957 $3.09 1979 $12.642001 $21.84 1958 $3.01 1980 $21.59 2002 $22.51 1959 $2.901981 $31-772003 $27.54 1960 $2.88 1982 $28.52 2004 $38.93 1961 $2.89 1983 $26.19 2005 $46.47 1962 $2.90 1984 $25.88 2006 $58.30 1963 $2.89 1985 $24.09 2007 $64.67 1964 $2.88 1986 $12.51 2008 $91.48 1965 $2.86 1987 $15.40 2009 $53.48 1966 $2.88 1988 $12.58 2010 s71.21 1967 $2.92 1989 $15.86 2011 $87.04 1968 $2.94 1990 $20.03 2012 93.02 1969 $3.09 1991 $16.54 2013 $97.91 1970 83.18 1992 $15.99 2014 $93.26 2015 $48.79 ences Using the 1949 oil price and the 1959 oil price, compute the annual growth rate in to 2 decimal places) oil prices during those 10 years. (Round your answer Annuse growth (ole6.37 6.371 % Annual growth rate
Step by Step Solution
There are 3 Steps involved in it

Get step-by-step solutions from verified subject matter experts