

Question: roblem 4-42 Spreadsheet Problem Dil prices have increased a great deal in the last decade. The following table shows the average oil price for each
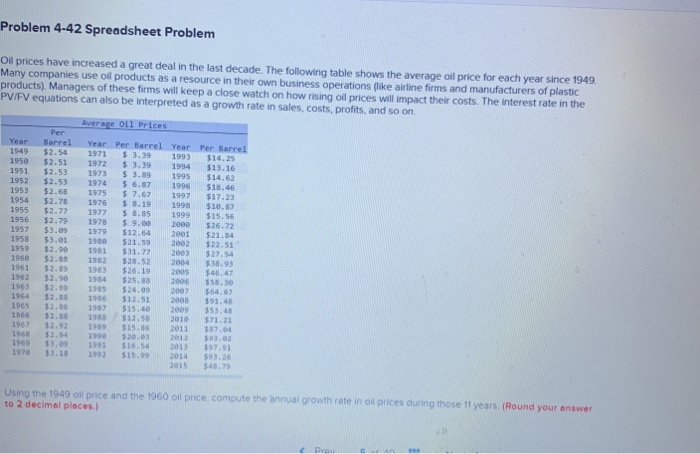
"roblem 4-42 Spreadsheet Problem Dil prices have increased a great deal in the last decade. The following table shows the average oil price for each year since 1949 Many companies use oil products as a resource in their own business operations (like airline firms and manufacturers of plastic aroducts) Managers of these firms will keep a close watch on how rising oil prices will impact their costs. The interest rate in the V/FV equations can also be interpreted as a growth rate in sales, costs, profits, and so on. Average Oil Prices Year 1949 1950 1951 1952 1953 1954 1955 1956 1957 1958 1959 1960 1961 1962 1963 1964 1965 1966 1967 1963 1969 Barrel $2.54 $2.51 $2.53 52.53 52.63 $2.78 52.77 52.79 $3.09 $3.01 $2.90 $2.53 $2.39 52.90 12.39 $2.08 $2,00 52. Per Barrel $14.25 $13.16 $14.52 516.66 $17.23 $10.87 $15.56 $26.72 $21.54 Year Per Barrel Year 1971 $ 3.39 1993 1972 $ 3.39 1994 1973 $ 3.89 1995 1974 56.37 1996 1975 $ 7.67 1997 1975 58.19 1995 1977 $8.85 1999 1978 $ 9.00 2000 1979 $12.64 2001 21.5 2002 1981 $31.77 2003 1952 $38.52 2004 1953 $26.19 1984 $25.88 2006 1985 $26.09 2007 $12.51 1907 $15,00 200 1913 $13.58 2010 $15.56 2011 1990 120.03 2012 4 2013 $15. 2015 527.54 $38.93 $5,30 $64.67 12.4 1. 1 $53.48 S7121 557 593.03 $97.91 5932 54,70 Using the 1949 oil price and the 1960 oil price, compute the annual growth rate in all prices during those 11 years (Round your answer to 2 decimal places.)
Step by Step Solution
There are 3 Steps involved in it

Get step-by-step solutions from verified subject matter experts