

Question: Problem 5 ( 4 0 pts . ) A particular product is delivered to a consumer in lots of 6 , 0 0 0 units.
Problem pts
A particular product is delivered to a consumer in lots of units. The average percent defective is p
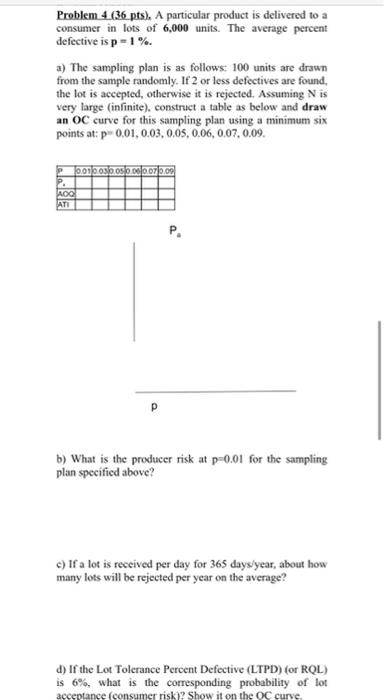
a The sampling plan is as follows: units are drawn from the sample randomly. If or less defectives are found, the lot is accepted, otherwise it is rejected. Assuming N is infinite, construct a table as below and draw an OC curve p vs Pa for this sampling plan using a minimum of six points at: p
P
Pa
AOQ
ATI
b What is the producer risk for this sampling plan?
c If a lot is received per day for daysyear about how many lots will be rejected per year on the average?
d If the worst percent defective Lot Tolerance Percent Defective LTPD received at the by the consumer is what is the corresponding probability of lot acceptance ie the consumer risk Show it on the OC curve.
e How many bad lots of this quality are expected to be accepted per year?
f For the same question above, determine Average Outgoing Quality AOQ values for the same six p values p given above and plot the results. Explain its meaning with a sentence.
g Find Average Outgoing Quality Limit in this case. Explain what it means?
h Calculate the Average Total number Inspected ATI per lot for the same six p values and plot your result roughly p vs ATI
i What would be the average cost of inspection per lot if the lots come with average quality and inspection cost is KDunit
Step by Step Solution
There are 3 Steps involved in it
1 Expert Approved Answer
Step: 1 Unlock

Question Has Been Solved by an Expert!
Get step-by-step solutions from verified subject matter experts
Step: 2 Unlock
Step: 3 Unlock