

Question: Problem 5 For the battery system of Problem 3, we now add a voltage sensor which gives us a noisy reading of the battery voltage
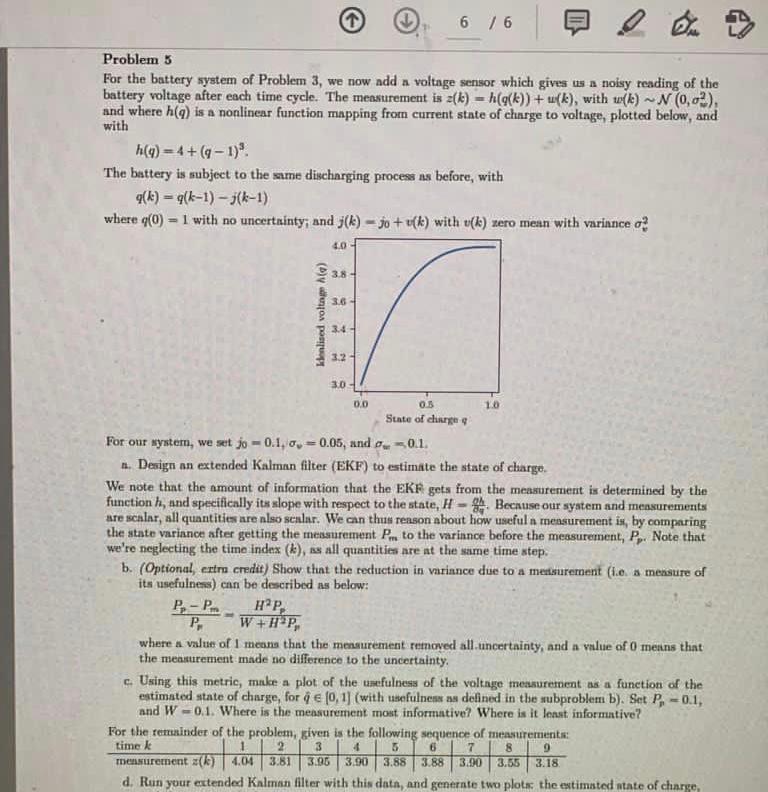
Problem 5 For the battery system of Problem 3, we now add a voltage sensor which gives us a noisy reading of the battery voltage after each time cycle. The measurement is z(k) = h(g(k))+ (), with wide) ~ N(0,02), and where h() is a nonlinear function mapping from current state of charge to voltage, plotted below, and with h(q) = 4+ (9-1)" The battery is subject to the same discharging process is before, with q(k) = 4(k-1) - j(k-1) where q(0) = 1 with no uncertainty, and 3(k) - Jo +v(k) with u(k) zero mean with variance o 40 3.8 3.6 - Kelised voltage Aa) 3.4 32 3.0 0.0 0.5 10 State of charge For our system, we set jo - 0.1, 0, -0.05, and 01. 1. Design an extended Kalman filter (EKF) to estimate the state of charge. We note that the amount of information that the EKF gets from the measurement is determined by the function h, and specifically its slope with respect to the state, H - Because our system and measurements are scalar, all quantities are nlso scalar. We can thus renson about how useful n mensurement is, by comparing the state variance after getting the messurement Pro to the variance before the measurement, P. Note that we're neglecting the time index (k), as all quantities are at the same time step. b. (Optional, extra credit) Show that the reduction in variance due to a mesurernent (ie a mesure of its usefulness) can be described as below: P-P HP, P. W+Hp, where a value of 1 means that the measurement removed all uncertainty, and a value of O means that the measurement made no difference to the uncertainty c. Using this metric, make a plot of the usefulness of the voltage measurement as a function of the estimated state of charge, for 9 (0.1) (with usefulnes as defined in the subproblem b). Set P, -0.1, and W-0.1. Where is the measurement most informative? Where is it least informative? For the remainder of the problem, given is the following sequence of measurements: time 2 3 mensurement (le) 404 3.81 3.95 3.90 3.883.883.00 3.18 d. Run your extended Kalman filter with this data, and generate two plotas the estimated state of charge, 6 7 8 9 1.00 3.31 3.06 3.00 Problem 5 For the battery system of Problem 3, we now add a voltage sensor which gives us a noisy reading of the battery voltage after each time cycle. The measurement is z(k) = h(g(k))+ (), with wide) ~ N(0,02), and where h() is a nonlinear function mapping from current state of charge to voltage, plotted below, and with h(q) = 4+ (9-1)" The battery is subject to the same discharging process is before, with q(k) = 4(k-1) - j(k-1) where q(0) = 1 with no uncertainty, and 3(k) - Jo +v(k) with u(k) zero mean with variance o 40 3.8 3.6 - Kelised voltage Aa) 3.4 32 3.0 0.0 0.5 10 State of charge For our system, we set jo - 0.1, 0, -0.05, and 01. 1. Design an extended Kalman filter (EKF) to estimate the state of charge. We note that the amount of information that the EKF gets from the measurement is determined by the function h, and specifically its slope with respect to the state, H - Because our system and measurements are scalar, all quantities are nlso scalar. We can thus renson about how useful n mensurement is, by comparing the state variance after getting the messurement Pro to the variance before the measurement, P. Note that we're neglecting the time index (k), as all quantities are at the same time step. b. (Optional, extra credit) Show that the reduction in variance due to a mesurernent (ie a mesure of its usefulness) can be described as below: P-P HP, P. W+Hp, where a value of 1 means that the measurement removed all uncertainty, and a value of O means that the measurement made no difference to the uncertainty c. Using this metric, make a plot of the usefulness of the voltage measurement as a function of the estimated state of charge, for 9 (0.1) (with usefulnes as defined in the subproblem b). Set P, -0.1, and W-0.1. Where is the measurement most informative? Where is it least informative? For the remainder of the problem, given is the following sequence of measurements: time 2 3 mensurement (le) 404 3.81 3.95 3.90 3.883.883.00 3.18 d. Run your extended Kalman filter with this data, and generate two plotas the estimated state of charge, 6 7 8 9 1.00 3.31 3.06 3.00
Step by Step Solution
There are 3 Steps involved in it

Get step-by-step solutions from verified subject matter experts